“Give me a screwdriver,” Russell Ackoff told his friend. The friend had just described a pinball machine. Pull the spring, a steel ball shoots up, and it drops out of the left exit or the right. The friend wanted the chance of a left exit. Ackoff wanted to take the machine apart. The friend said no: a screwdriver “spoils the problem.” What did Ackoff expect to find inside that a chance could not tell him?
The friend was Merrill Flood, a mathematics professor at the University of Michigan, whom Ackoff credited with the traveling salesman problem. Ackoff, who taught at the Wharton School, told the story in a recorded talk. Flood loved to give him puzzles whenever they met, and Ackoff said their solutions always needed new mathematics. The first one that day was a glass bowl, full of balls of one size, some white and some black. A player reaches in and pulls out a handful of n balls, and m of them are black. Then the player draws one more ball at random. What is the chance it is black? Flood called it “an unsolved problem in statistics.” Ackoff called it easy. “You just tell me how you know that the bowl contains only black & white balls,” he said, “and I’ll tell you the answer.”
Flood would not say. “I can’t do that, it’ll spoil a problem.” A puzzle with its setting stripped out, he argued, still teaches how to solve problems. Ackoff asked whether learning to box with one hand tied behind the back teaches a boxer to fight with two. So Flood changed the puzzle. Now every ball in the bowl looked white, but m of the handful had a black core. Ackoff asked how he knew that some had black cores. Then came the pinball machine: shoot in n balls, and m come out on the right. That was when Ackoff asked for the screwdriver. “I want to take the machine apart,” he said, “and see how it works.” Flood said, “you can’t do that … because it spoils the problem.” Three puzzles, one count, m out of n. The count fits a bowl of black and white balls, a bowl of cored balls and a pinball machine equally well. The count alone could not say which one Flood had built.
Ackoff never got the screwdriver. Ronald Fisher, a statistician at Rothamsted, an English farm research station north of London, had something like one: he knew how a potato plant grows. In 1923 he and a colleague, W. A. Mackenzie, published the weights of potatoes, lifted and weighed row by row, from twelve varieties grown under six kinds of manure. Rows of Up to Date with potash gave 23 pounds; rows of Duke of York with none gave under 2. Counted in pounds, the big varieties seemed to gain more from the manure than the small ones. Once Fisher used what he knew about the plant, the difference between the varieties was gone.
The raise letter comes in a white envelope on a Friday, still warm from the office printer, and the team hears one line: everyone got 3 percent. You earn $50,000, so your raise is $1,500. The coworker at the next desk earns $100,000, and theirs is $3,000. In percent, no raise differed from any other. In dollars, the gap between you grew by $1,500, and no count can say whether that is fair until someone knows how pay is made. Last year’s letter is probably in the same drawer. File this one without asking, and next year’s 3 percent starts from the wider gap.
So when is a count enough, and when does someone have to open the machine?
An Exercise, Not a Problem
Ackoff answered Flood’s bowl with a question of his own: how did Flood know? A chance worked out from a count is right only inside a story about how the count was made. For the bowl, that story has at least four parts. The balls are the same size. They are well mixed. The player draws without looking. Nobody adds or takes out a ball between draws. If any one of those parts changes, m out of n means something else.
Flood’s puzzle hid that story on purpose. Ackoff had a word for a question built that way. “What you’ve given me is an exercise,” he told Flood. An exercise, he said, is a question where someone is “depriving me of information which you need to formulate the problem.” By that test, he added, a case study is an exercise too. A problem comes with its machine. An exercise has the machine taken out, so only one answer is left to find.
A statistical test starts from the same kind of story, called the null hypothesis: the guess the count is checked against. A null hypothesis is a mental model written down, a small copy of the machine stated before the data arrive. The test can say how far the count sits from that copy. It cannot say whether the copy was the right machine.
Someone booking a table for a birthday dinner meets Flood’s bowl on a phone screen: 4.6 stars from 812 reviews. Some machine made those stars. The thing to look for is who left them and what made them write, a free dessert for a review or a cold plate sent back. The cue is the next booking, before the deposit goes in.
The balls in Flood’s bowl never touch each other. The parts of a car do.
Parts That Do Not Add
Ackoff once filled an imaginary garage with cars. He took the count from the New York Times: 457 models for sale in the United States. Buy one of each, he said, and ask 200 of the best automotive engineers which car has the best engine, the best transmission, the best of every part. Then build a car from the winners. “Do we get the best possible automobile? Of course not. You don’t even get an automobile. Why not? The parts don’t fit.”
The definitions of a system agree on one thing: a system’s parts cannot be judged one at a time. The microbial ecologist Allan Konopka puts it in a statistician’s terms. “A system is ‘complex’,” he writes, “if the relationships between system constituents are not strictly additive or linear.” An engine’s worth depends on the transmission it is bolted to.
Drug trials measure that dependence, and their rulebook, ICH E9, names it.
“The situation in which a treatment contrast (e.g. difference between investigational product and control) is dependent on another factor (e.g. centre). A quantitative interaction refers to the case where the magnitude of the contrast differs at the different levels of the factor, whereas for a qualitative interaction the direction of the contrast differs for at least one level of the factor.”
An interaction works like a key and a lock: a key’s worth depends on which door it meets. One door opens, and the next stays shut. Two taps filling a bathtub are the case with no interaction, since the hot tap adds its litres whatever the cold tap does. Where the picture fails: a key is all or nothing, and most interactions are a matter of degree.
Someone planning a group trip can build Ackoff’s garage without meaning to: the best planner, the best driver and the best cook, each picked alone. The thing to look for is how each one’s part depends on the others. Two planners may both want the final word, or the driver may want to leave at six while the cook wants to shop first. The cue is the next group chat about a trip.
Measuring an interaction takes a field where one part changes while the other holds still.
Twelve Potatoes, Six Manures
In the early 1920s, a field at Rothamsted grew twelve kinds of potato side by side. Half the field got farmyard dung, fifteen tons to the acre. In each half, some rows got sulphate of potash, some got muriate of potash, and some got neither; both are forms of potash, a potassium fertilizer. Every variety met every manure, three times over, on 0.162 acres. At harvest, 213 rows were lifted and weighed.
Fisher’s question was the garage question again: do the varieties differ in how they answer manure? If they do, a farmer cannot pick the best potato and the best manure separately. The best of each might not fit.
Fisher and Mackenzie answered it with a new kind of bookkeeping. In their words, “the sum of all the squares of deviations from the general mean may be divided up into two parts.” Today the method is called analysis of variance. It works like splitting a shared restaurant bill by who ordered what, so each line on the bill has an owner.
Their bill had four lines, out of 11,740 units of spread in all. Manure owned 6,158, and variety owned 2,843. Rows treated exactly alike, the field’s own noise, owned 1,758. That left 981 that neither variety nor manure explained alone, like a dessert two diners shared. Those 981 were the place to look for an interaction. Fisher turned them into a standard deviation, the typical miss, the way a bus has a usual number of minutes early or late. For the leftovers, the typical miss came to 4.22, against 3.53 for the noise. The leftovers were bigger than noise, he wrote, “but not sufficiently to be significant.”
A home gardener who switched to a new tomato seed and a new fertilizer in the same spring, and doubled the crop, holds a bill like Fisher’s. The thing to look for is which change did it, and whether the answer depends on the other. The cue is the next seed order.
The 981 had an owner after all, and who owned them depended on a choice Fisher had made without saying so.
Sum or Product
Fisher’s table, read as a sum, predicts minus 2.3 pounds for Duke of York with no dung and no potash. The sum formula gives each variety its own pounds and each manure its own pounds, and adds them. Duke of York sits far below average, and so do the bare rows. Added together, they go below zero. Fisher and Mackenzie saw that the sum formula’s predictions “are often negative in the unmanured series.”
No row of potato plants fills a sack with minus two pounds. Fisher did not need a test to say so. He needed what he knew about the machine. “No one would expect to obtain from a low yielding variety,” he wrote, “the same actual increase in yield which a high yielding variety would give.” That sentence works like Ackoff’s screwdriver: it opens the plant before the count. A plant does not get a fixed number of extra pounds from potash. Its yield gets multiplied.
So Fisher fitted a product instead. Each variety gets its own size, each manure its own multiplier, and the yield is one times the other. In the half with no dung, the product formula says sulphate of potash multiplied every variety’s yield by about 3.3. One multiplier for all twelve means no interaction on that scale. Yet in pounds, the gains fan out (Figure 1).
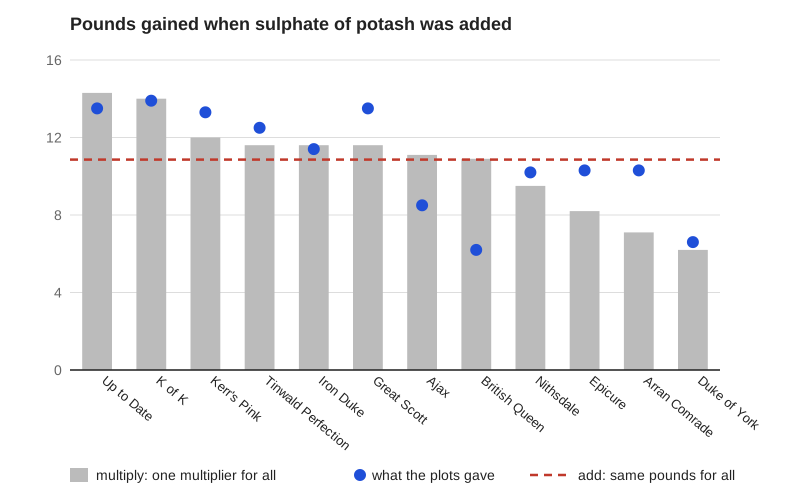
Figure 1. Pounds of potatoes gained per row when sulphate of potash was added, in the half of the field with no dung. Grey bars: the product formula, one multiplier for every variety. Blue dots: what the rows gave. Dashed red line: the sum formula, the same 10.9 pounds for every variety. Drawn for this piece from Fisher and Mackenzie (1923), Tables II and VI.
Up to Date’s predicted gain is 14.3 pounds, and Duke of York’s is 6.2, from a formula with no interaction in it. The rows gave 13.5 and 6.6. Counted in pounds, the varieties answer potash differently. Counted as multiples, they answer alike, within the noise. The plant’s biology says which scale is the plant’s own.
The numbers agreed with the biology but could not settle the choice of scale. Leftovers from the product formula came to 3.92, against the noise of 3.53. The sum formula’s leftovers had come to 4.22. Neither gap was large enough to be significant. Fisher’s conclusion kept both halves. “There is no significant variation in the response of different varieties to manure.” The yields “are better fitted by a product formula than by a sum formula.” A count is enough to say how often. To know whether the parts add or multiply, someone has to open the machine.
The raise letter in the drawer works like Fisher’s table with two rows. Its 3 percent is one multiplier for everyone: no interaction in percent, and a gap that widens in dollars. Does the company think pay adds, the same dollars for the same work, or multiplies? The letter does not say, because the answer is about the machine, not the count.
Fisher could open the potato because botanists had already opened it for him. Most machines arrive sealed, and opening one takes a different kind of field.
A Questionnaire for Nature
In 1926, the winter oats in one Rothamsted field grew in 96 plots that chance had arranged. T. Eden, who had laid out the potatoes, spread nitrogen on them as sulphate or muriate of ammonia. Each plot got one dose, two doses, or none, early or late in the season. That made twelve treatments, repeated in eight blocks, with the order in each block drawn by chance (Figure 2).
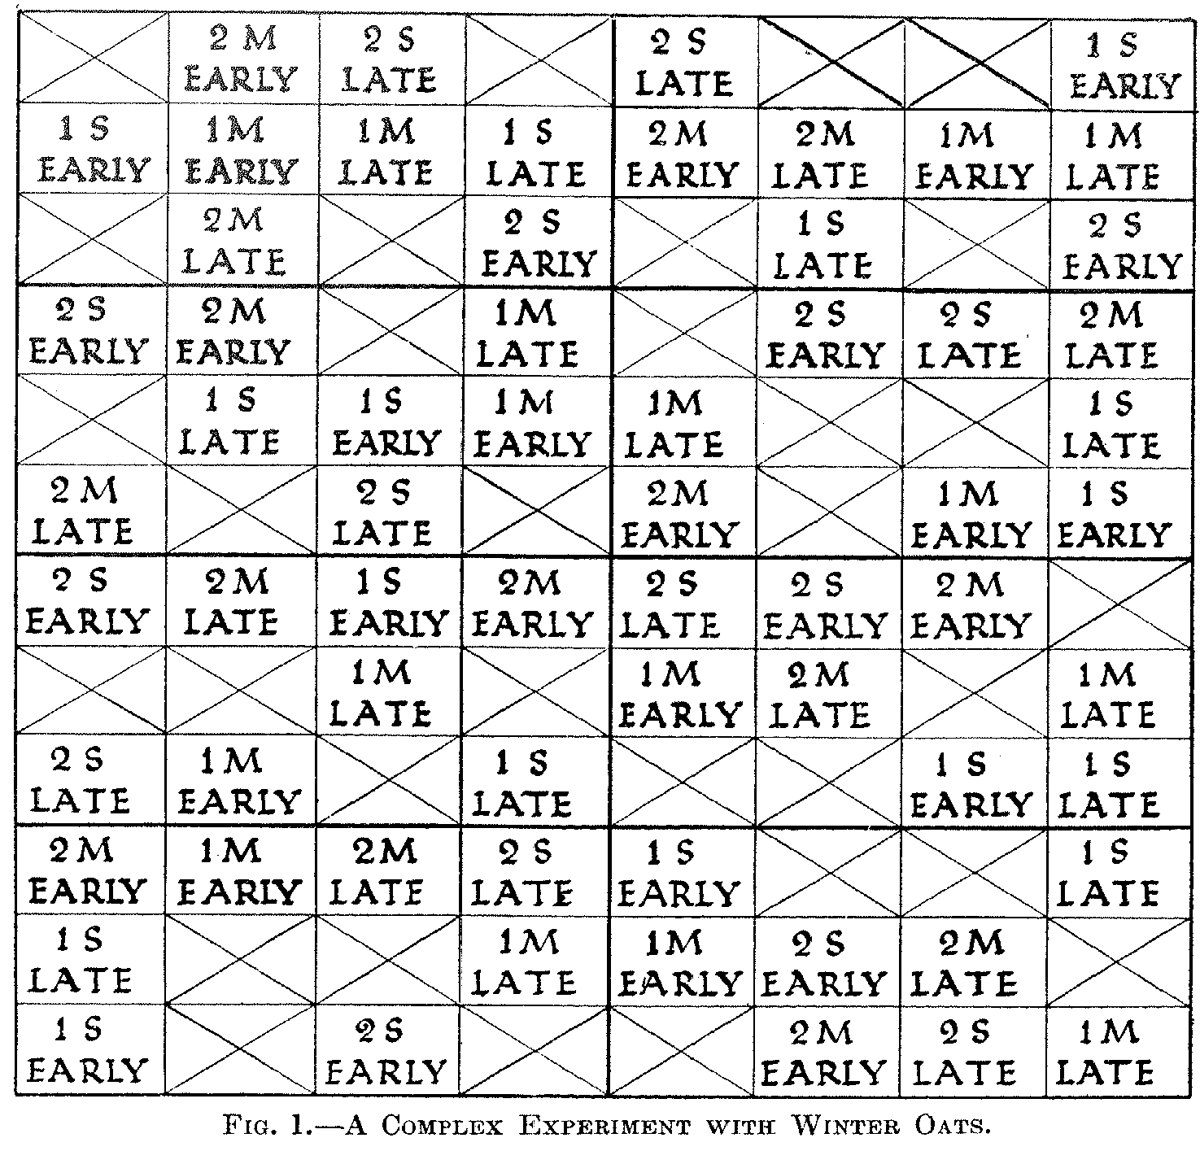
Figure 2. “A Complex Experiment with Winter Oats”: twelve treatments in eight randomized blocks, S for sulphate and M for muriate of ammonia, 1 or 2 doses, early or late; crossed squares had no nitrogen. Fisher (1926), Fig. 1, p. 512. Published by HMSO, Crown copyright expired; public domain.
Fisher wrote the plan up as a dare to his own profession. “No aphorism is more frequently repeated in connection with field trials, than that we must ask Nature few questions, or, ideally, one question, at a time. The writer is convinced that this view is wholly mistaken.” Nature, he suggested, “will best respond to a logical and carefully thought out questionnaire.” Ask her a single question, and “she will often refuse to answer until some other topic has been discussed.”
The questionnaire is what statisticians now call a factorial, or crossed, design. Every level of one factor meets every level of the others, in the same season. Answering the main questions one at a time, Fisher wrote, “would require 224 plots, against our 96.” The crossed field also asks the potato question. In the oat plan, he wrote, “no possible interaction of the factors is disregarded.” Does a late dose help sulphate more than muriate? One question at a time can never ask that, because the other factor is held still. When no botanist has opened the machine, a crossed field works like Ackoff’s screwdriver: it sets the parts against each other and watches what they do together.
In one block of his own plan, Fisher noted, the muriate plots “are all bunched together in the middle.” He left them there: the plan was fixed before a single oat came up. The paper shows the plan, not the harvest: it gives no oat yields.
The gardener with the tomato bed can ask Fisher’s question too. Next spring, the bed splits into four patches: the old seed and the new, each with and without the new fertilizer. If the fertilizer helps the new seed alone, a season of one change at a time would never show it. The neighbor who swaps seeds over the fence is the one to send this to.
At the same station, someone would hand Fisher a claim with no plots at all: one person, a tea urn and a row of cups waiting to be poured.
A Closing Invitation. The screwdriver stood for knowing how a machine combines its parts before trusting what its count says. A count answers how often; only the machine says whether the parts add or multiply.
- Open your last raise. Now, with the phone in your hand, open your last pay stub, raise letter or rent notice. Is the change stated in percent or in dollars? Whose gap with yours did it widen, and by how much?
- Open the stars. Pull up the last restaurant you booked and read three of its reviews out loud to the friend who always picks the place, in person or on a call. What made each person write: the food, a free dessert, a cold plate? Whose evening does the average describe?
- Open two changes together. Before your next seed order or planning meeting, write two changes on one yellow sticky note: a new seed and a new fertilizer, or a new meeting time and a shorter report. If both go in at once, do they add, or does one change the other? What would two separate tries cost?
Flood’s glass bowl still sits on the table, m black out of n, and a hand filled it before the first draw. The screwdriver is for asking whose hand, and how.
Where This Came From
The site’s name came from this pairing: “I like statistics and I like systems thinking, so the name puts the two together.” Ackoff’s talk, which also runs through this site’s first essay, is the systems half. Fisher’s potatoes are the statistics half.
Intellectual Honesty Note. The Ackoff quotes come from a machine transcript of the recorded talk, cleaned only where the meaning was plain (“ball” for bowl, “in statistics”). The potato plots were laid out on a fixed “chess-board” plan, not by chance; Fisher’s randomized blocks came later. Fisher compared standard deviations through their logarithms, not with a modern F test, so the piece reports his verdict and numbers, not a p-value. K of K was planted twice, not three times, in the undunged series. The minus 2.3 pounds and the multiplier of about 3.3 (0.983 over 0.300, Table VI) are this piece’s own arithmetic from the paper’s tables; the rows’ own ratios scatter around that one fitted multiplier. The raise letter, the birthday dinner, the group trip and the gardener are invented, and the raise arithmetic is illustrative.
References
Ackoff, R. L. (2015, November 2). Systems thinking speech by Dr. Russell Ackoff [Video]. YouTube. https://www.youtube.com/watch?v=EbLh7rZ3rhU
Fisher, R. A. (1926). The arrangement of field experiments. Journal of the Ministry of Agriculture of Great Britain, 33, 503-513.
Fisher, R. A., & Mackenzie, W. A. (1923). Studies in crop variation. II. The manurial response of different potato varieties. The Journal of Agricultural Science, 13(3), 311-320. https://doi.org/10.1017/S0021859600003592
International Council for Harmonisation. (1998). E9: Statistical principles for clinical trials. https://database.ich.org/sites/default/files/E9_Guideline.pdf
Konopka, A. (n.d.). Systems thinking [Substack post]. Think Microbe.