One patient in an Alzheimer’s drug trial lost more brain plaque than anyone else on the high dose. Over the trial’s 78 weeks, the patient got worse. On the brain scan, the bright patches of plaque faded toward the cool colors of an empty brain. On the dementia score, the number climbed three points, and a higher number is worse. In June 2021, the drug was approved for clearing the plaque.
The drug was aducanumab, and the FDA, the US agency that approves medicines, approved it early. Plaque is clumps of a sticky protein that build up between nerve cells in the brains of people with Alzheimer’s disease. The clumps show up on a PET scan, a brain picture taken after an injection of a tracer that sticks to them. Clearing the plaque was meant to stand in for a slower loss of memory, years before anyone could see the memory itself. Two large trials had tested the drug, and both were built the same way, to follow each patient for 78 weeks. Both were stopped halfway, in March 2019, because neither looked likely to win. Then the rest of the data came in. One trial said yes, and the other said no.
The FDA’s statistician on the case, Dr. Massie, wrote the agency’s statistical review. It runs past a hundred pages and takes the trials one problem at a time. Its summary of the results opens with a single line: “Inconsistency on many levels summarizes the final clinical efficacy data from these trials.” Because both trials were stopped, the application “doesn’t contain a single phase 3 study that was fully completed according to the plan.” Halfway through the review is a plot of every high-dose patient whose plaque was measured (Figure 1). Each dot is one patient, and each color one trial. Across is how much plaque the patient lost by Week 78, and further left is more plaque gone. Up is how much worse the patient’s dementia score got.
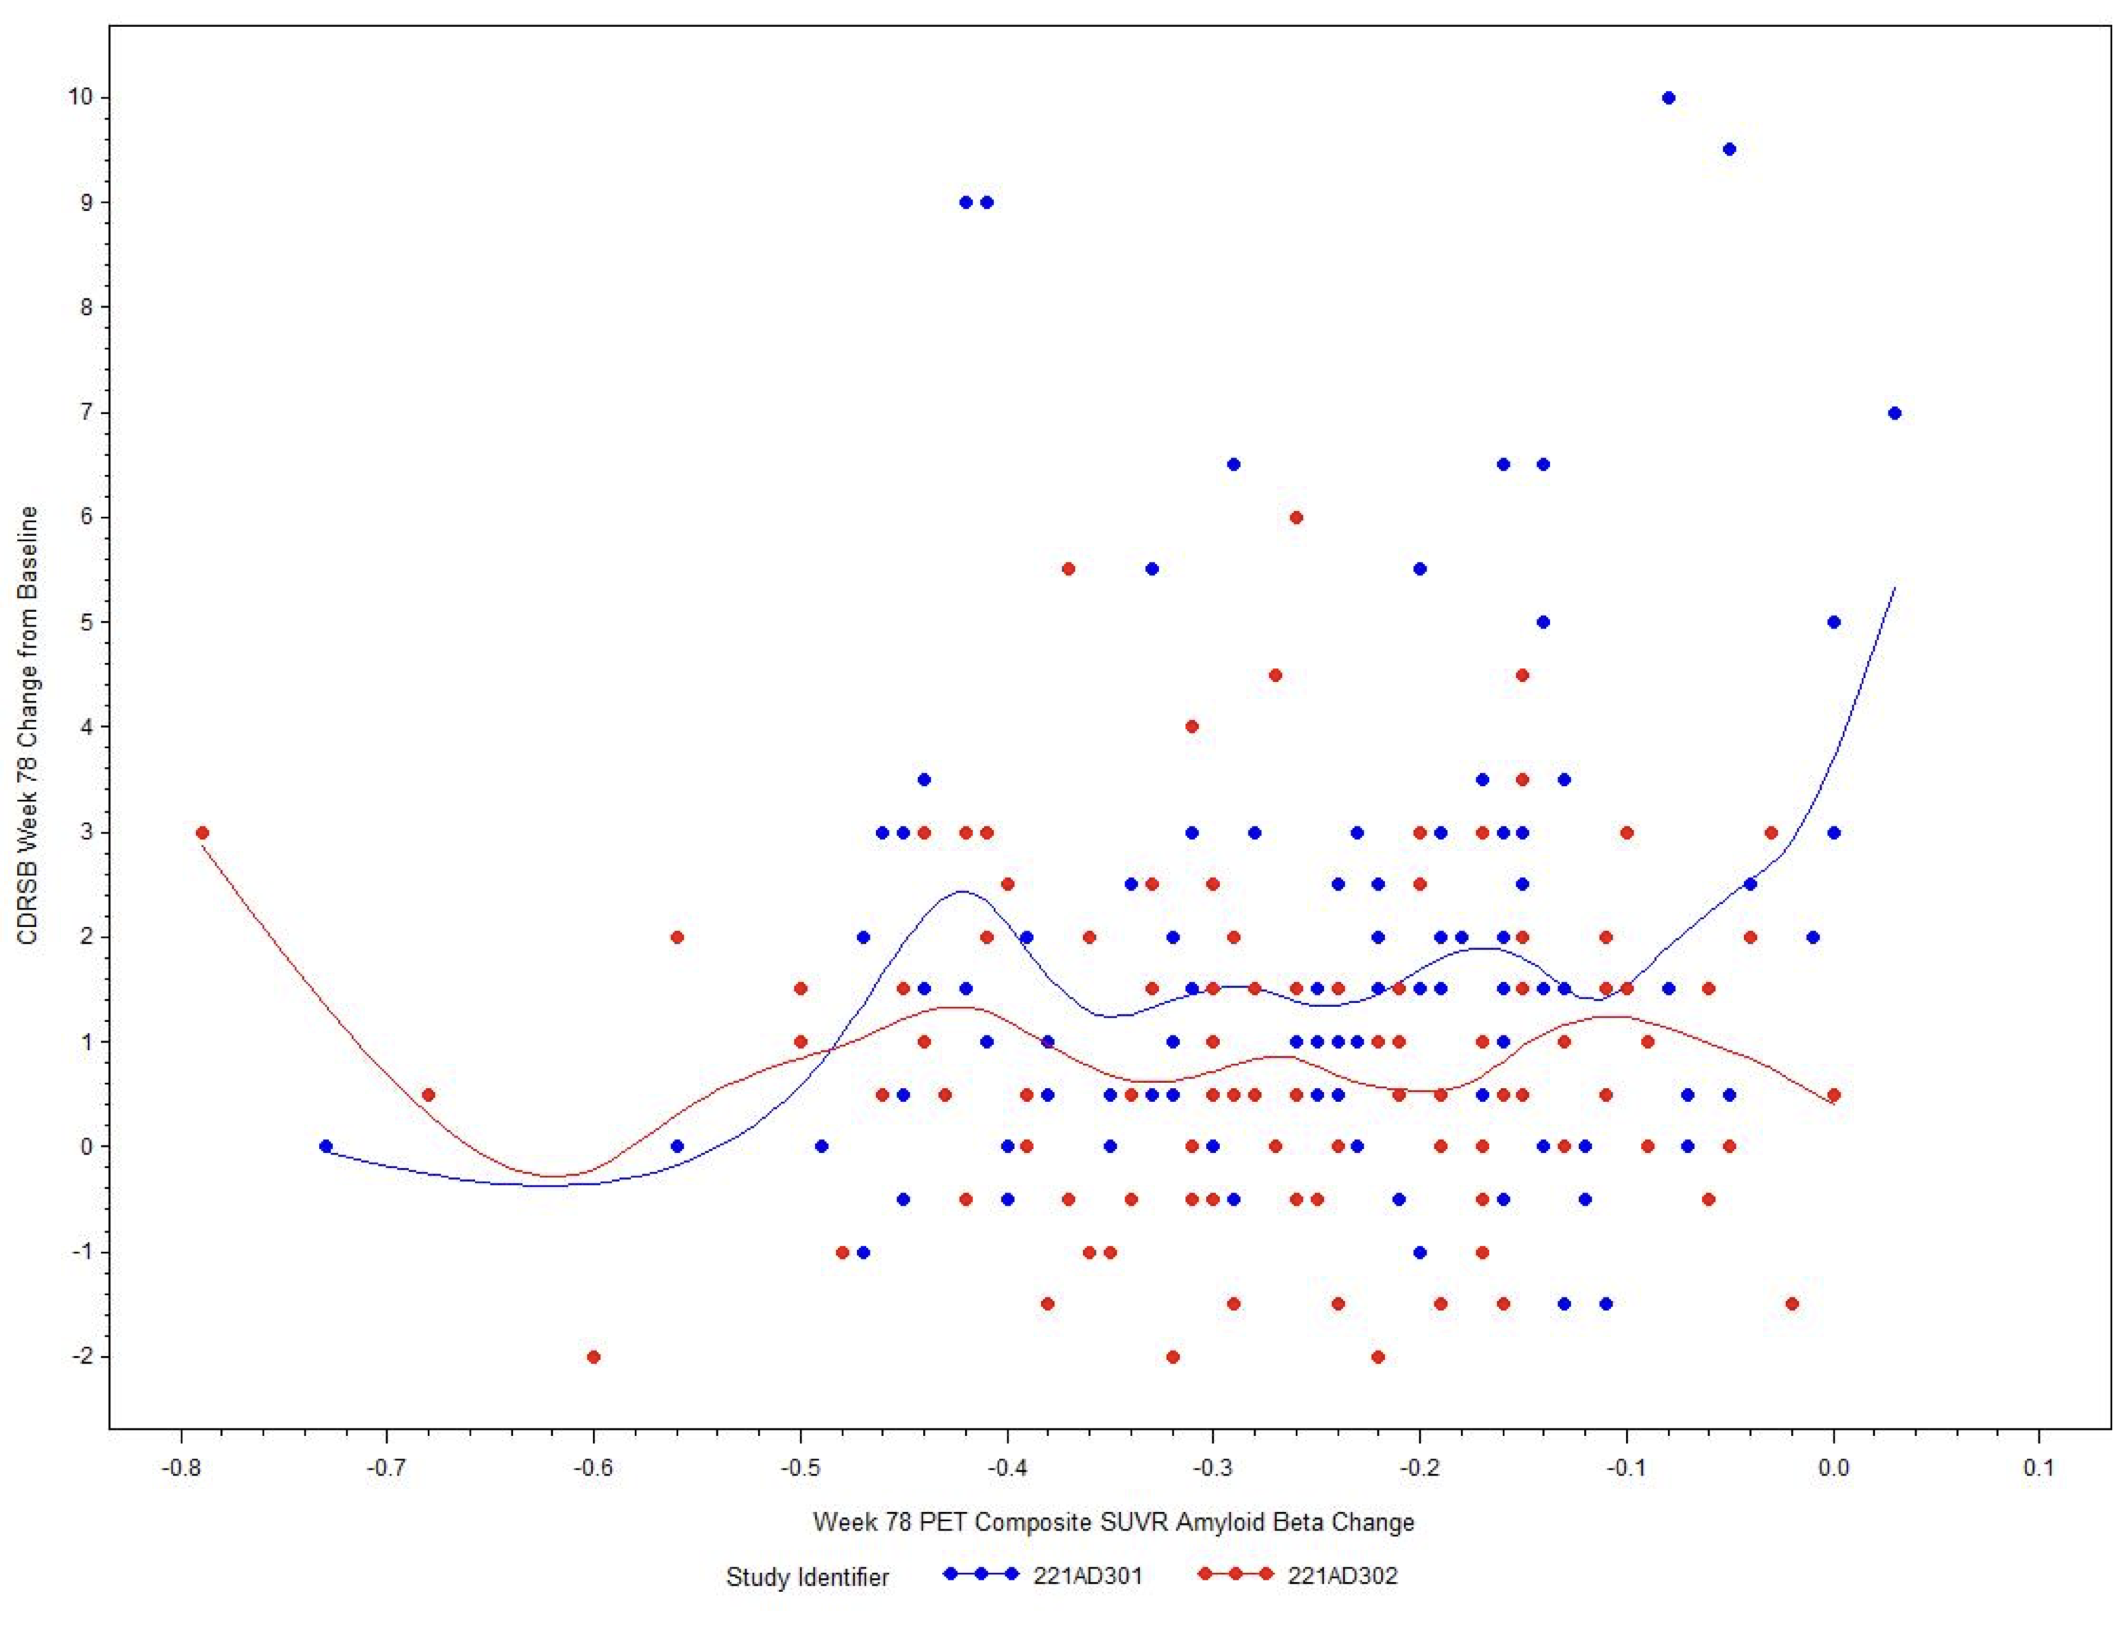
Figure 1. Plaque change against dementia-score change at Week 78, for every high-dose patient in the two trials’ plaque-scan groups: trial 301 in blue, trial 302 in red. The red dot at the far left is the patient who lost the most plaque. FDA statistical review of BLA 761178 (Massie, 2021), Figure 18, p. 55. A work of the US government, public domain.
That patient was in trial 302, the trial that said yes. In both trials, the drug cleared about the same amount of plaque. In one trial, patients on the drug did a little better than patients on a dummy drug. In the other, they did a little worse. The scan told one story twice, and the patients told two. How did a yes and a no, from two trials built the same, become a yes?
Your father’s memory-clinic visit is three weeks away, and the referral letter is folded in your coat pocket. He still hums the songs from his wedding, but he asks the date twice an hour. The doctor may offer a drug that clears plaque, with a scan to show it working. You would be the one driving him to the infusions. In the trial that won, over 78 weeks, scores on the dummy drug worsened 1.74 points and on the high dose 1.35. Eighteen months of drives bought 0.39 points; would his clean scan mean he was doing better? Say yes at the visit, and the drives start before anyone can answer.
One Yes and One No
On March 21, 2019, a press announcement stopped both trials. Each had enrolled about 1,640 people with early Alzheimer’s disease, split among a dummy drug, a low dose and a high dose. A check of the data so far gave each trial less than a 20 percent “chance of success” if it ran to the end. Stopping a trial early for that reason is called stopping for futility.
When the scores from the closing visits came in, the picture flipped. In the review’s words, the final analysis “on face showed a statistically significant effect for the high dose in one of the two trials (p=0.01) but not the other (p=0.83).”
Peter Stein, director of the FDA’s Office of New Drugs, named the score: “the Clinical Dementia Rating-Sum of Boxes (CDR-SB), the standard clinical trial endpoint in AD.” In trial 302, the high dose slowed the worsening by 0.39 points against the dummy drug. The review gives that gap a 95 percent range. The range runs from 0.09 to 0.69 points, so the true slowing could be small. A p-value of 0.01 says a gap that big would turn up about once in a hundred tries if the drug did nothing. In trial 301, patients on the high dose did 0.03 points worse than the dummy drug, a result chance explains easily. Figure 2 sets the two trials side by side, the stand-in above and the scores below.
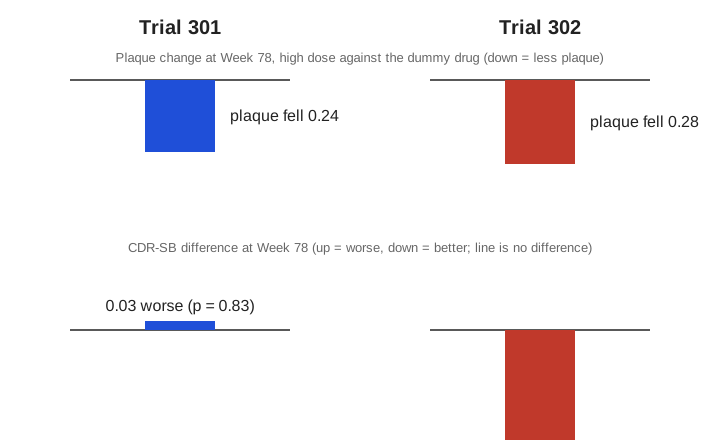
Figure 2. Same drop, opposite scores. Top: the fall in plaque at Week 78, high dose against the dummy drug, in trial 301 (0.24) and trial 302 (0.28). Bottom: the difference in CDR-SB at Week 78, 0.03 worse in 301 (p = 0.83) and 0.39 better in 302 (p = 0.012). Drawn for this piece from the FDA statistical review.
US drug law asks for a particular kind of proof before a drug can be sold.
“evidence consisting of adequate and well-controlled investigations, including clinical investigations, by experts qualified by scientific training and experience to evaluate the effectiveness of the drug involved, on the basis of which it could fairly and responsibly be concluded by such experts that the drug will have the effect it purports or is represented to have under the conditions of use prescribed, recommended, or suggested in the labeling or proposed labeling thereof.”
The law allows one strong trial plus other proof, so one yes can be enough. Dr. Massie counted “only one positive study at best”. The review’s verdict was plain: “substantial evidence has not been met in this application.”
A headline that pings into the family chat says a new drug “worked.” It names one trial. The reader’s question is how many trials there were, and what the other one found. Which of two results counts depends on rules written before the data came in.
Rules Set Before the Data
Biogen, the drug’s maker, wrote back to the FDA with a new reading of its own rules. The trials’ written plan tested two doses, a low one and a high one, on the main score first and then on the scores after it. The plan said what had to win before the next test could run. The maker argued “that if the high dose was significant on the primary then it could be tested on the secondary regardless of the primary result for the low dose.”
Dr. Massie did the arithmetic. Read that way, the chance of at least one false win “could be as high as .0975.” The plan had been built to hold that chance to 0.05, or one in twenty. The new reading nearly doubled it. “For this reason strong control is needed,” the review answered. The FDA has a name for that rise.
“This higher-than-intended overall Type I error rate when multiple tests are conducted without adjustment is called the multiplicity problem.”
A Type I error is a false win: calling a drug better when it is not. Writing the order down first works like calling a pool shot: a ball that drops into a pocket nobody called does not count. A test the plan did not name first is that uncalled ball, and it may have dropped by luck.
A second rule covers when the data stop changing. In trial 302, staff were still correcting patient records after the blind was broken, after the team learned who had the drug. A second memory test moved from p = 0.0620 to p = 0.0493 while they did. The line it crossed was 0.05.
A team that checks a dashboard against six goals each quarter meets the multiplicity problem too. A goal that has not truly changed still has a one-in-twenty chance of looking as if it moved. By this piece’s own arithmetic, six such goals give about a one-in-four chance of a lucky win somewhere. If only the goal that moved gets reported, the team can spend the next quarter chasing luck. The question for the next quarterly review deck is which goal was named first, before the numbers came in. Rules decide which test counts. They cannot say which patients the win belongs to.
Who the Drug Helped
While trial 302 was running, a change to its plan raised the dose for one group of patients. Protocol amendment 4 “increased the dose from 6 mg/kg to 10 mg/kg for APOE carriers.” APOE is a gene, and ε4 is its risky form, or allele. The US National Institute on Aging puts it this way: “APOE ε4 increases risk for Alzheimer’s and is associated with an earlier age of disease onset in certain populations. About 15% to 25% of people have this allele.”
Dr. Massie saw a problem in the timing. Patients on the dummy drug who joined after the change seemed to decline faster. A worse dummy group makes any drug look better. “The study 302 success could be explained by a higher placebo progression after the implementation of protocol amendment 4.” Peter Stein read the data and disagreed. In his memo, the effects before and after the amendment “are very similar, not supporting the concern raised by Dr. Massie on this point.”
An effect that depends on something else about the patient has a name in trials.
“The situation in which a treatment contrast (e.g. difference between investigational product and control) is dependent on another factor (e.g. centre). A quantitative interaction refers to the case where the magnitude of the contrast differs at the different levels of the factor, whereas for a qualitative interaction the direction of the contrast differs for at least one level of the factor.”
An interaction works like a fertilizer that feeds the tomatoes and wilts the basil. One average for the whole garden hides two answers. The garden differs in one way: in trial 302, the gene also changed a carrier’s dose.
The review found three such splits. On a second memory test, high-dose patients without the gene did worse than the dummy drug, and the split between carriers and non-carriers gave p = 0.0096. That is a change of direction, the qualitative kind. The effect also changed by country (p = 0.0095). Leaving out Japan moved that to 0.040. Leaving out Spain alone took it to 0.0599, past the 0.05 line. The third split was the amendment itself.
An adult child whose parent has just had a genetic test at the memory clinic can use the gene split. The thing to look for is whether the drug’s effect was shown for people with the parent’s result: a carrier, like about one person in five, or not. The follow-up visit, when the result is read out, is the moment to ask. Every one of these splits counted only patients who reached Week 78.
The Patients Who Left
For almost half the patients, Week 78 never came. About 45 percent of the patients enrolled “did not have the opportunity to complete Week 78 due to the futility stopping of the trials.” The patients did not leave. The trial left them, on March 21, 2019. The stop that flipped into a yes is also the hole in the trials’ data.
What to do about a missing score depends on what the trial set out to estimate, and what counts when something interrupts a patient’s course. Someone has to guess how the missing patients would have scored, then check whether the answer survives a different guess. An international trial guideline, ICH E9(R1), calls that check a sensitivity analysis.
The review ran one kind, called a tipping point. It asks how much worse the missing patients would have to be before the win disappears. The answer was small. If high-dose patients with no Week 78 score did a little more than 0.3 points worse than those who finished, the result was no longer significant. The whole effect was 0.39 points. A result that tips over at 0.3 is standing on one foot.
A manager opening a staff survey with nearly half the team’s rows blank is missing answers too. The thing to look for is how the result would change if the silent half felt a little worse than those who wrote back. The share who did not answer sizes the risk, and the next survey results email is the cue. The plaque scans, the trials’ stand-in for memory, had a test of their own to pass.
What the Scan Stood In For
The June 2021 approval rested on the plaque, through a faster route. The rule, as it read when the drug was approved:
“FDA may grant marketing approval for a biological product on the basis of adequate and well-controlled clinical trials establishing that the biological product has an effect on a surrogate endpoint that is reasonably likely, based on epidemiologic, therapeutic, pathophysiologic, or other evidence, to predict clinical benefit or on the basis of an effect on a clinical endpoint other than survival or irreversible morbidity.”
In the rule’s words, the plaque was the surrogate endpoint: a stand-in for how a patient feels, functions or survives. Peter Stein’s memo gives the rule’s plain version. The pathway “is intended to provide earlier access to drugs for serious diseases with unmet medical needs.” It is used “where there is some uncertainty at the time of approval regarding the drug’s ultimate clinical benefit.” That is how one yes and one no became a yes: the plaque fell in both trials, and the rule let the plaque stand in.
A drug built to clear plaque should move the plaque. That is its job. The test of a stand-in runs the other way. Once the plaque change is known, is there anything left of the drug’s effect to explain? If the plaque carries the benefit, nothing should be left. Statisticians named that test after Ross Prentice, who wrote it down in 1989.
“The criterion involves examining in a cohort or intervention study whether an exposure or intervention effect, adjusted for the intermediate endpoint, is reduced to zero.”
Dr. Massie ran the test. A PET scan turns the plaque into one number, which the review calls the SUVR. Added to the main analysis, each patient’s plaque change added nothing (p = 0.884). The maker’s own analysis said the plaque explained 33 percent of the high dose’s effect and 36 percent of the low dose’s. Its ranges ran down to zero. How much of the effect the plaque explains, if any, is not known. Among high-dose patients, the plaque change and the score change were “essentially uncorrelated.” The review concludes: “there is no evidence that the SUVR change is a surrogate for clinical change.”
Back on Figure 1, the cloud of dots lies flat. If the plaque stood in for the patients, the dots would slope down toward the left: more plaque gone, less decline. The red dot at the far left is no longer a surprise. It is the test’s answer, drawn by one patient.
Someone opening a patient portal to a lab result marked “improved” on a new medicine can ask the test’s question. Has this number been shown to move when patients feel, function or live better, or only when the drug is taken? One number on a report can decide a year of refills. The next lab result is the cue, and the question is worth passing to the sibling who drives a parent to the memory clinic. “Reasonably likely” was enough for the approval. Which stand-ins has the agency accepted, and on what proof? On the far left of Figure 1, one red dot stays three points up, beside a scan that came back clean.
A Closing Invitation. The plaque that was gone stood for every number a drug moves before anyone has shown it moves with the patient. A stand-in earns its place only when it explains what the drug did to people.
- Read one number. Now, with the phone in your hand, open the last lab result in your patient portal, a cholesterol reading or a blood sugar. What does that number stand in for: a heart attack, a lost toe, a tired afternoon? Is there one you were never told?
- Ask about the other trial. The next time a drug headline lands in the family chat this month, type back one line, or ask it out loud over dinner. How many trials were there, and what did the other one find? Does a pill a relative already takes rest on one yes?
- Write the question on the letter. Before a parent’s next memory-clinic visit, or your own next checkup, write one line in pen on the appointment letter: has this number been shown to move when patients do better? At the visit, before any infusion or refill is booked, listen: does the answer name a patient or a scan?
The plaque was gone from the scan, and the score still climbed. A line in pen asks the clean picture what Dr. Massie asked it: did it move with the person?
Where This Came From
I read the FDA statistical review of aducanumab, BLA 761178, section by section, with Peter Stein’s concurrence memo beside it. Different specialists review an FDA application, each in a distinct technical domain, and reading the review in order shows how the safety, manufacturing and clinical data build upon one another. I read some FDA reviews, not all the time, because I took classes on bioequivalence, and some examples in those classes require referring back to the FDA review. The aducanumab review’s last test is older than the drug. Three years after Prentice, in 1992, Freedman, Graubard and Schatzkin turned it into the share of an effect a marker explains, the number the maker reported for the plaque.
Intellectual Honesty Note. The test for the plaque is Freedman, Graubard and Schatzkin’s criterion as Dr. Massie applied it, checked against their abstract. The opening patient is one patient, an illustration of the flat cloud, not evidence alone; the faded bright patches are how an amyloid PET scan shows less plaque, not this patient’s own image. The plaque figures come from the trials’ scan groups, a subset of patients. The statute quoted is the drug law; aducanumab is a biologic, and the review applies the phrase to this application. The father, the letter, the dashboard, the survey, the pool shot and the garden are invented. The one-in-four is this piece’s arithmetic, assuming six independent goals. The p-value readings are simplified.
References
21 C.F.R. § 601.41. Legal Information Institute. https://www.law.cornell.edu/cfr/text/21/601.41
Federal Food, Drug, and Cosmetic Act § 505(d), 21 U.S.C. § 355(d). Legal Information Institute. https://www.law.cornell.edu/uscode/text/21/355
Freedman, L. S., Graubard, B. I., & Schatzkin, A. (1992). Statistical validation of intermediate endpoints for chronic diseases. Statistics in Medicine, 11(2), 167-178. https://doi.org/10.1002/sim.4780110204
International Council for Harmonisation. (1998). E9: Statistical principles for clinical trials. https://database.ich.org/sites/default/files/E9_Guideline.pdf
International Council for Harmonisation. (2019). E9(R1) addendum on estimands and sensitivity analysis in clinical trials. https://database.ich.org/sites/default/files/E9-R1_Step4_Guideline_2019_1203.pdf
Massie, T. (2021). Statistical review and evaluation [BLA 761178, aducanumab] (with concurrence by K. Jin, S.-J. Wang and J. Hung). U.S. Food and Drug Administration, Center for Drug Evaluation and Research. https://www.accessdata.fda.gov/drugsatfda_docs/nda/2021/761178Orig1s000StatR_Redacted.pdf
National Institute on Aging. (2023). Alzheimer’s disease genetics fact sheet. https://www.nia.nih.gov/health/genetics-and-family-history/alzheimers-disease-genetics-fact-sheet
Prentice, R. L. (1989). Surrogate endpoints in clinical trials: Definition and operational criteria. Statistics in Medicine, 8(4), 431-440.
Stein, P. (2021, June 7). [Concurrence memorandum], BLA 761178. U.S. Food and Drug Administration, Office of New Drugs. https://www.accessdata.fda.gov/drugsatfda_docs/nda/2021/Aducanumab_BLA761178_Stein_2021_06_07.pdf
U.S. Food and Drug Administration. (2022). Multiple endpoints in clinical trials: Guidance for industry. https://www.fda.gov/media/162416/download