In a New York delivery room in the early 1950s, a baby came out and the wall clock’s second hand began to sweep. Sixty seconds later, someone gave the baby a score. It was not the obstetrician who had just delivered it. It was the anesthesia resident, a doctor still in training, standing by the mother’s head.
The resident felt for a pulse in the cord, about two inches from the navel, and counted. A helper could hold the cord and tap out each beat with one finger. Was the baby breathing? When a soft rubber tube went into its nose, did it grimace, sneeze or cough? Were its arms and legs bent, or limp? Was it pink all over? Each of the five questions got a zero, a one or a two, and the five were added. Ten was the best a baby could get. The score sheet was five lines long.
The sheet came from Virginia Apgar, who taught anesthesia at Columbia. Before it, doctors described a newborn’s slow, weak start as “mild, moderate and severe depression.” Apgar wrote that those words left “a fair margin for individual interpretation.” Two doctors could look at one baby and choose two different words, and no one could add the words up. A ward full of “moderate” babies could not be compared with the ward across town. Her five lines could be added, and the totals could be compared from one hospital to the next. At Sloane Hospital for Women, her residents scored 1,021 babies this way. The obstetricians on the ward started to compete. Apgar noted their “competitive spirit” and how they “took great pride in a baby with a high score.” A doctor who had just delivered a baby now waited, at the end of the first minute, for someone else’s number. Then the records showed which of those 1,021 babies lived through their first month.
On a Sunday evening this month, the week’s job postings are open on your phone. One has a clean logo. One is at a company a friend likes. One just feels right, so you apply. By the end of the month you have sent twenty applications and heard back from two. A friend asks every Sunday how the search is going, and you give the same answer as last week. You cannot tell the friend what to change, because you cannot tell yourself. Twenty applications, each sent for a different reason, cannot say which of your reasons is working.
Apgar’s residents were not the most experienced people in the room. They had the least stake in the birth. So why would their five quick marks, made in one minute, say more than the eye of the doctor who delivered the baby? And would twenty job applications say more if each had been asked the same five questions?
Four Ways to Say Framework
Apgar’s whole method fit on one card.
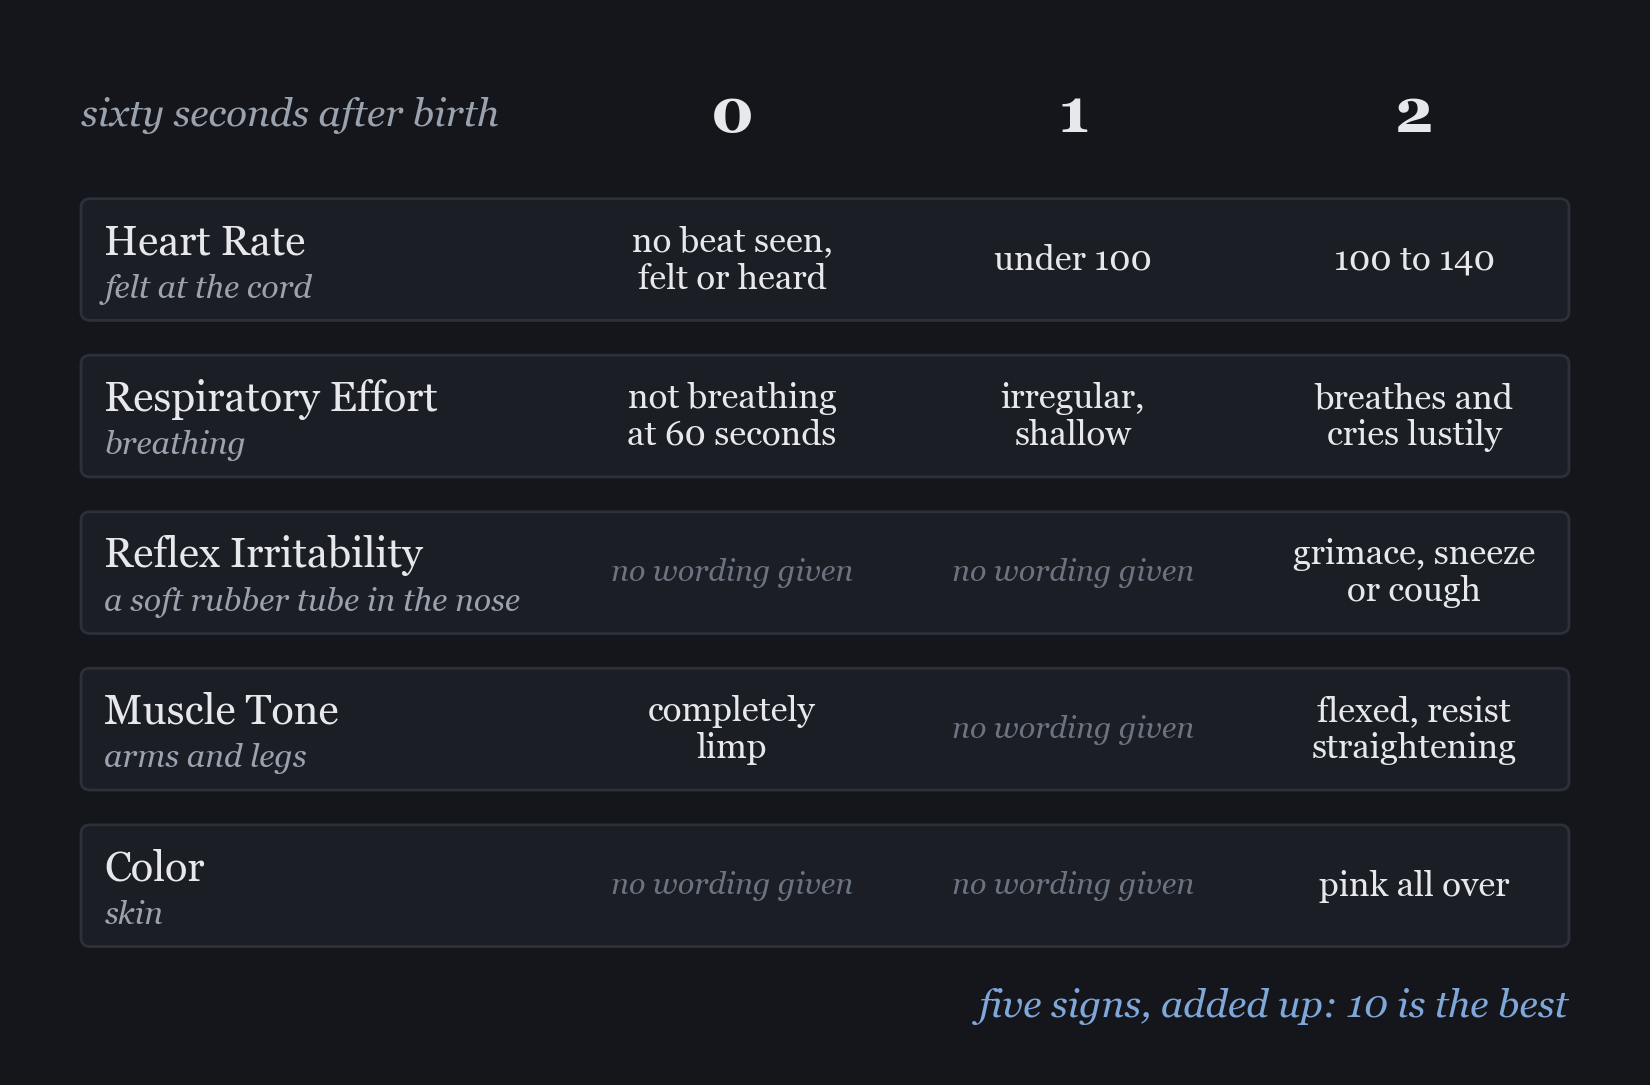
Figure 1. The five signs and what earned a 0, 1 or 2, in Apgar’s words. Each row is one sign, each column one mark. Where she described only some answers, the cell says so. Drawn for this piece, after Apgar (1953), pp. 261-262.
Five questions, three answers each, the same on every baby, whoever held the clock. Many fields have a name for a fixed set of questions like that one. The name is framework, and four fields defined it in four ways.
“A framework is a set of classes that embodies an abstract design for solutions to a family of related problems, and supports reuses at a larger granularity than classes.”
Johnson and Foote wrote software. A class is a reusable piece of a program, and a framework is a bigger piece, reused whole. It works like the floor plan a builder uses for every house on a street: the paint and the tiles change from house to house, but the plan stays. The key words are “a family of related problems.” The problems differ, and the design that solves them does not.
“The mechanical method involves a formal, algorithmic, objective procedure (e.g., equation) to reach the decision.”
Grove and Meehl were psychologists, and they set the mechanical method against another one. “The clinical method relies on human judgment that is based on informal contemplation and, sometimes, discussion with others.” A doctor at a case conference uses the clinical method. A doctor adding up five numbers on a card uses the mechanical one.
“A framework provides the basic vocabulary of concepts and terms that may be used to construct the kinds of causal explanations expected of a theory.”
Ostrom won a Nobel Prize in economics for studying how people share a lake, a forest or a pasture. Her framework is a list of things to look at in every shared resource, from “Wisconsin lakes” to “the planet Earth.” It works like the headings on a form that every study fills in, so two studies can be laid side by side.
“The main purpose of the EtD frameworks is to help groups of people (panels) use evidence in a structured and transparent way to inform decisions…”
GRADE writes the rules many medical panels use to turn studies into advice. Its framework has three main parts, one for each step: “formulating the question, making an assessment of the evidence, and drawing conclusions.” When two panels reach different advice, the shared steps show where they parted.
The four do not agree on everything. Johnson and Foote make a framework a design that programs reuse. GRADE makes it steps that a panel runs. Ostrom makes it the shared words that theories and models are built from. Grove and Meehl set it against a person’s judgment. But all four hold one part of the method the same from case to case: every house on the street, every patient, every lake, every panel.
Someone reading job postings on the bus can check the next posting against the last. Are the questions asked of it the same ones asked of the last posting, or new ones? A week of postings, read with new questions each time, leaves nothing to set side by side. The harder part is choosing which questions go on the card.
Five Signs Out of Many
Apgar did not start with five questions. “A list was made of all the objective signs which pertained in any way to the condition of the infant at birth.” From that list she kept five “which could be determined easily and without interfering with the care of the infant.”
Each of the five is a guess about what trouble looks like in a baby’s first minute: a slow heart, no breath, no grimace, a limp body, blue skin. A baby’s weight is not on the card, and neither is the length of the labor. That set of guesses is a mental model, the small copy of a system a person carries in their head. The framework is the part that asks the model’s questions the same way every time.
A model can be wrong about one line, and Apgar’s was. Color “caused the most discussion among the observers.” Babies are born blue, and many kept “cyanotic hands and feet,” blue hands and feet, “for reasons still mysterious to us.” Few babies scored a two for color. When several hundred babies were rated again a few minutes later, almost all of them had turned pink. By the end of her paper, she called color “relatively unimportant” at one minute.
She could say that only because the card had not changed. Every baby got the same five questions, so the weak question showed up as weak.
Someone about to send the next application can write down five things to check in every posting. They might be the pay, the commute, the team, the skills asked for and room to grow. The thing to look at is what the list leaves out, and whether each thing was left out on purpose. A list of five is still only a guess until it has been run on many postings, the way Apgar’s was run on every baby.
The Same Way, Every Baby
A baby who gasped at thirty seconds, then stopped, scored zero for breathing. Apgar gave the reason: “he was apneic at the time decided upon for evaluation.” Apneic means not breathing. The gasp did not count, because the rule asked about the sixtieth second.
Three babies had heart rates over 140, which the card did not cover. “I was puzzled as to the proper way to rate this,” Apgar wrote. She gave them the full two points and kept going.
That stubbornness made the count possible. The paper does not say why 712 other babies born alive in her seven and a half months of records were not scored. The scores fell into three piles: low, middle and high. The low pile scored 2 or less, and the high pile 8 or more. Of the 65 babies in the low pile, 9 died in their first month. That is 14 percent. Of the 182 in the middle pile, 2 died. Of the 774 in the high pile, 1 died. That is 0.13 percent.
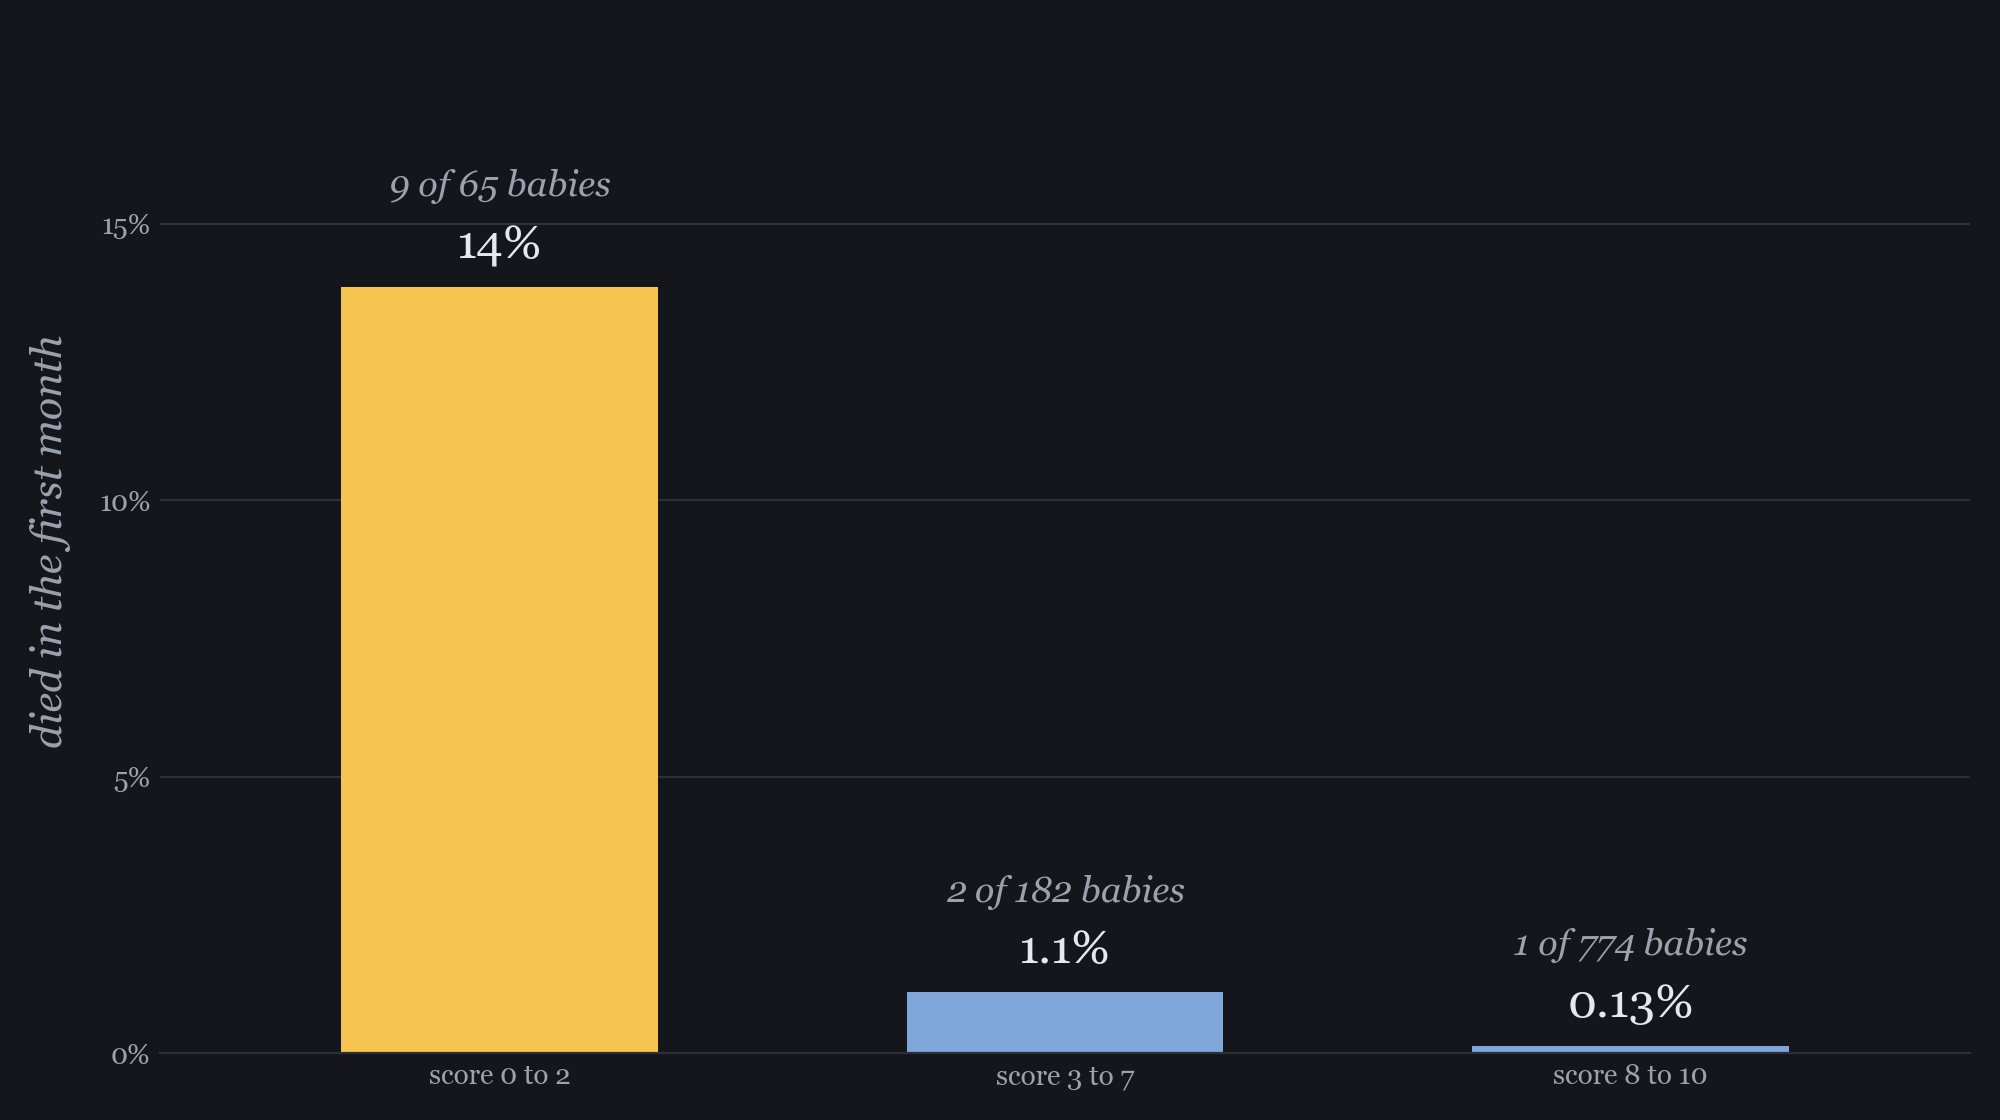
Figure 2. Babies who died in their first month, by their score at sixty seconds. The tallest bar belongs to the lowest scores. Drawn for this piece from Apgar (1953), p. 267.
The low pile’s death rate was about a hundred times the high pile’s. That division is this piece’s, not Apgar’s. The twelve babies who died had averaged 2.3 points. The scores came from residents, and Apgar found the resident’s score “sufficiently accurate.” A doctor in training, asking five fixed questions, was enough.
Twelve deaths are too few to give the gap an exact size, and Apgar said as much: the groups were “still too small” to analyze statistically. But “mild depression” could not have made three piles at all. Her stated aim was a basis for “comparison of the results of obstetric practices.”
Someone with a spreadsheet of this month’s applications can score each one on the same five lines. On Sunday evening, when the week’s replies are in, the thing to look at is the replies per ten applications, pile by pile. Ten applications in a pile is a small count, like Apgar’s twelve deaths. The piles still say more than twenty separate reasons can. What about the posting that scores low and still feels right?
Counted Across Cases
By 1996, 136 studies had set an expert’s feel for a case against a formula. Each asked which one better predicted how a person would do. Grove and Meehl gathered them. The formula was “almost invariably equal to or superior to” the expert.
In 2000, Grove and four colleagues pooled the studies in one analysis. On average, the formulas were about 10 percent more accurate. They clearly won in 33 to 47 percent of the studies, depending on the analysis. The experts clearly won in 6 to 16 percent. Experts also fell further behind the formula, not closer, when they had interviewed the person.
The formula did not win because it was wiser. On any single case, it can be wrong, and a gifted judge can beat it. A framework is judged by its rate across all its cases, not by one. That rate exists only because the rule did not change from case to case. Hold the rule still, then count. An expert’s hits can be counted too, as the 136 studies did. But when the reasons shift with each case, a miss cannot be traced to any one of them. Apgar’s three piles work like a report card for her framework: a grade for each pile, earned across 1,021 babies. A statistician reads a test the same way: not as right or wrong on this case, but as a procedure with an error rate over many cases.
Holding still also shows the rule its own misses. Apgar noticed that “in an occasional instance the color was worse at five minutes than at sixty seconds, and these cases were therefore missed with our usual method of evaluation.” A miss like that has a name only because the method had a usual way to work.
In 1996, Grove and Meehl could not say for sure why so many experts trusted the eye over the formula. They offered only “possible causes of widespread resistance.”
Someone about to send an application the five-line score says to skip can still send it. The step is to mark it on the sheet as an override. A week later, the reply or the silence goes beside it. After a month, the two reply rates can be set side by side: the score’s picks against the overrides. The friend who asks about the search every Sunday can keep the tally, and that Sunday question finally gets an answer with numbers in it. Twenty rows of marks on the sheet, and one more column filled in by hand.
A Closing Invitation. The score sheet stood for a few questions asked the same way every time, so their misses can be counted. A job search can ask five of its own, and learn by next month which reasons bring replies.
- Notice the reasons. Right where you sit, recall why each of the last three applications you sent went out: the logo, a friend’s word, the photos of the office. Was it one reason three times, or three different ones?
- Write the card. Before Sunday, write five questions on an index card or the back of an envelope: pay, commute, team, skills, room to grow, or your own five. Which one sounds wrong read aloud? Which would you drop first, and why?
- Mark the override. The next time a posting feels right, a mission you believe in or a city you love, write “override” beside it before you send it. At the end of the month, which pile heard back more, the overrides or the rest? Would the friend who checks in on Sundays count the two piles with you?
Five lines on an index card, propped beside the laptop, a column of zeros, ones and twos down the side. One row is marked “override” in pen.
Where This Came From
Each of the four definitions came out of a different argument. In 1954, Meehl’s Clinical versus Statistical Prediction set an expert’s judgment against a formula, and the 1996 count grew from that book. In 1988, Johnson and Foote wrote down what programmers meant by the word. Ostrom first set framework, theory and model apart in 2005. In 2016, GRADE turned the steps from evidence to advice into one framework.
Apgar never used the word. She called her method “grading,” and she wrote that scoring a patient as “a sum total of several objective findings” was not new. It had been used to judge the treatment of drug addiction, in a 1938 government study by Lawrence Kolb and Clifton Himmelsbach.
Intellectual Honesty Note. Reading Apgar’s mortality table as a framework’s error rate is this piece’s own reading, and so is the hundredfold division. Apgar named no baby, doctor or resident, and none is named here; the delivery room scene follows her description of the method, not one recorded birth. Her paper prints the scoring in prose, with no sheet or table. The score sheet and the card are this piece’s picture of it, and Figure 1 marks the cells she gave no wording for. The job search is a hypothetical. Meehl’s 1954 book, Ostrom’s 2005 book and the 1938 addiction study were not reread for this piece; each is cited through a later source.
References
Alonso-Coello, P., Schünemann, H. J., Moberg, J., Brignardello-Petersen, R., Akl, E. A., Davoli, M., Treweek, S., Mustafa, R. A., Rada, G., Rosenbaum, S., Morelli, A., Guyatt, G. H., Oxman, A. D., & the GRADE Working Group. (2016). GRADE Evidence to Decision (EtD) frameworks: A systematic and transparent approach to making well informed healthcare choices. 1: Introduction. BMJ, 353, i2016. https://doi.org/10.1136/bmj.i2016
Apgar, V. (1953). A proposal for a new method of evaluation of the newborn infant. Current Researches in Anesthesia and Analgesia, 32, 260–267.
Grove, W. M., & Meehl, P. E. (1996). Comparative efficiency of informal (subjective, impressionistic) and formal (mechanical, algorithmic) prediction procedures: The clinical-statistical controversy. Psychology, Public Policy, and Law, 2(2), 293–323. https://doi.org/10.1037/1076-8971.2.2.293
Grove, W. M., Zald, D. H., Lebow, B. S., Snitz, B. E., & Nelson, C. (2000). Clinical versus mechanical prediction: A meta-analysis. Psychological Assessment, 12(1), 19–30. https://doi.org/10.1037/1040-3590.12.1.19
Johnson, R. E., & Foote, B. (1988). Designing reusable classes. Journal of Object-Oriented Programming, 1(2), 22–35. https://www.laputan.org/drc.html
Kolb, L., & Himmelsbach, C. K. (1938). Clinical studies of drug addiction III. Public Health Reports, Supplement 128, 23–31. (Cited in Apgar, 1953.)
McGinnis, M. D., & Ostrom, E. (2014). Social-ecological system framework: Initial changes and continuing challenges. Ecology and Society, 19(2), 30. https://doi.org/10.5751/ES-06387-190230
Meehl, P. E. (1954). Clinical versus Statistical Prediction: A Theoretical Analysis and a Review of the Evidence. University of Minnesota Press.
Ostrom, E. (2005). Understanding Institutional Diversity. Princeton University Press.