A Dutch nurse once took a bad feeling to the chief pediatrician. It was September 2001, and the night before, a baby six months old had died at the brick children’s hospital in The Hague (Figure 1). The hospital recorded the death as natural. The nurse was worried about who had been on duty: Lucia de Berk, again.
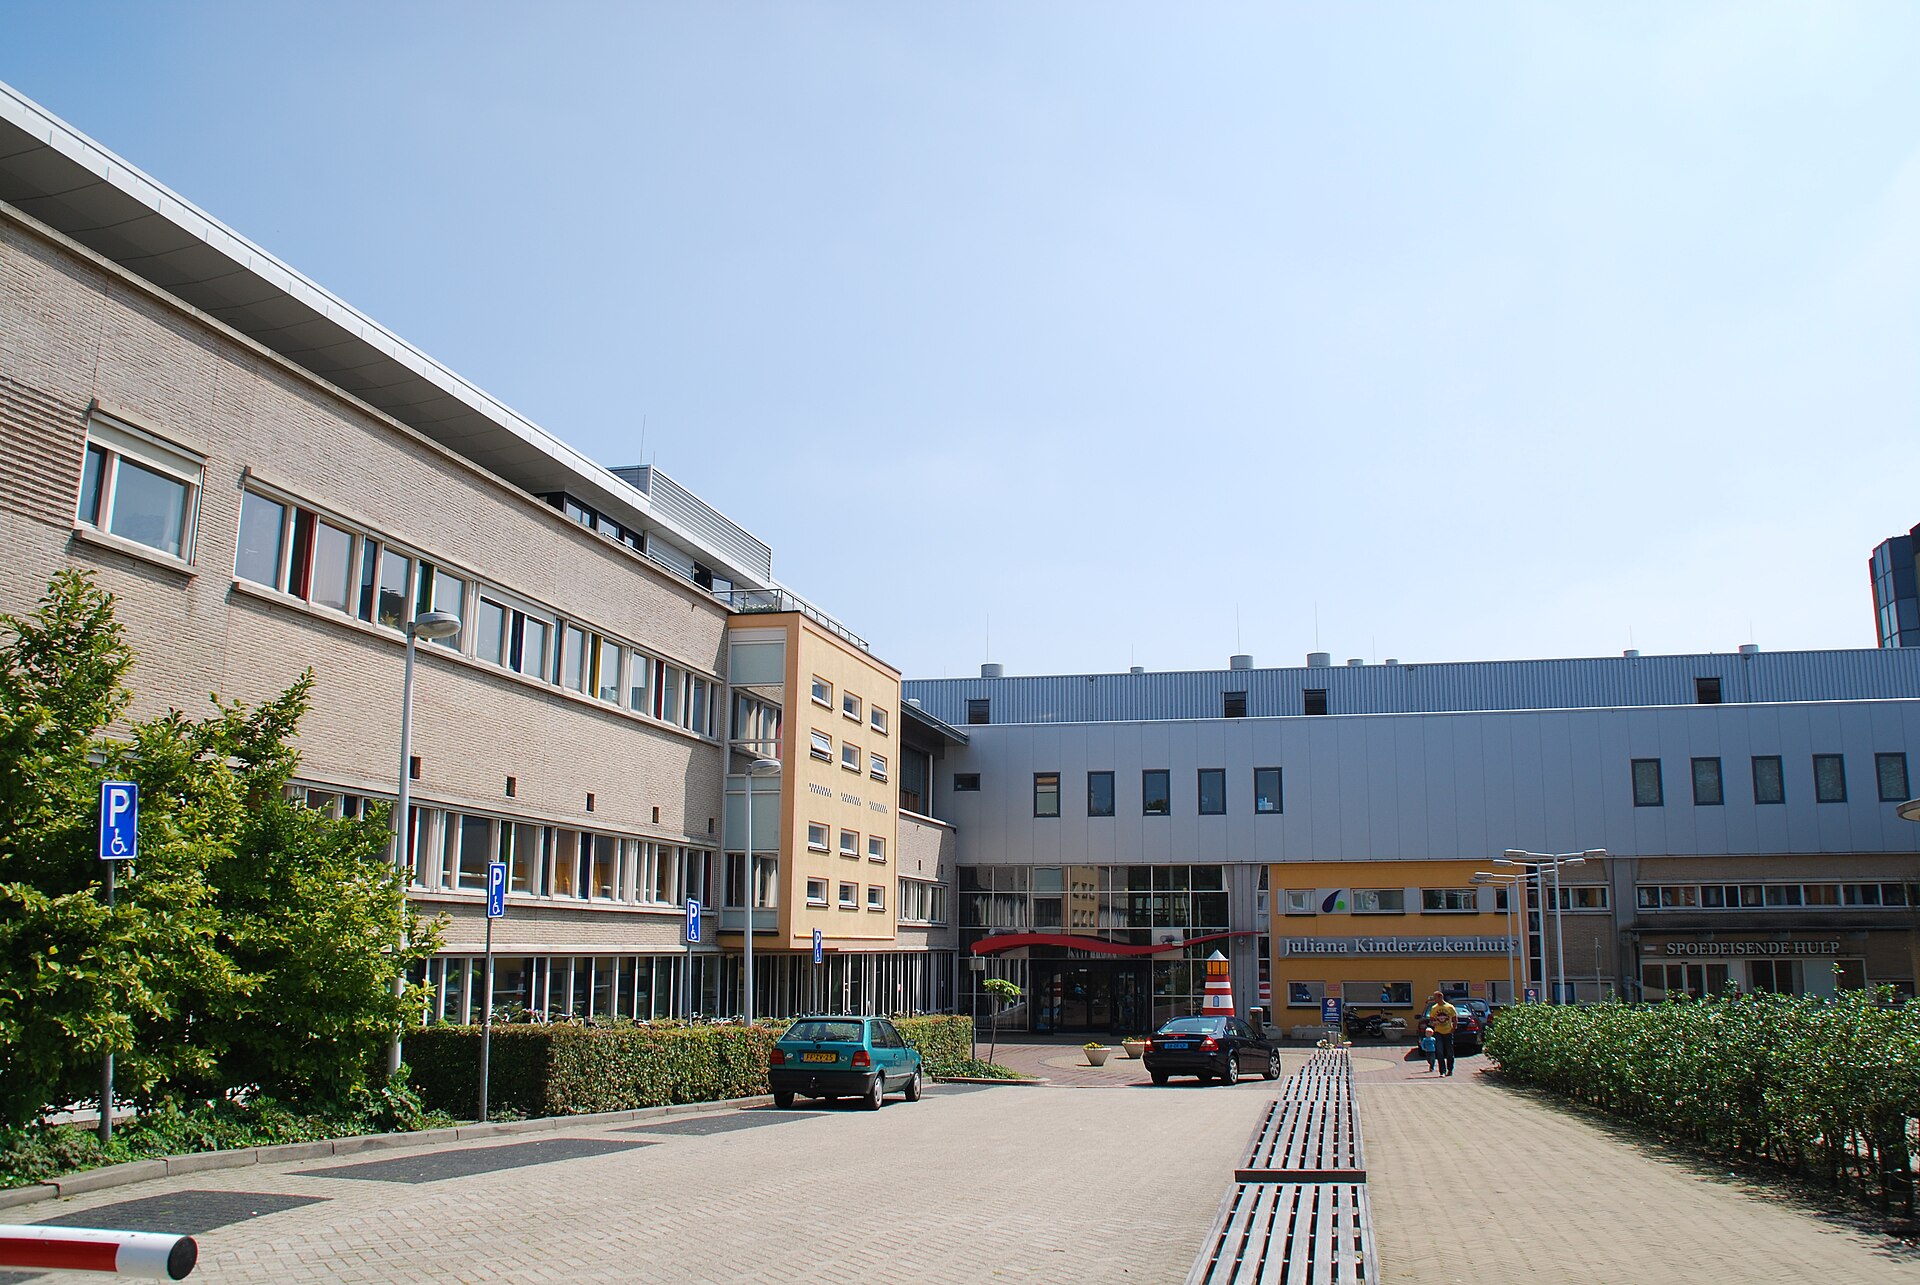
Figure 1. The Juliana Children’s Hospital at Sportlaan 600 in The Hague, its home from 1999 to 2015, where the bad feeling started. Photo: Joris (2011), CC BY-SA 3.0, via Wikimedia Commons.
Someone at the hospital ran her shifts through an Excel spreadsheet and called it no coincidence. The same day, the baby’s death was changed to unnatural. Within ten days, more than thirty incidents and deaths at two hospitals had been blamed on her. On September 14 the hospital held a press conference and reported five deaths and five other incidents to the police. She was arrested that December and pleaded innocent.
The court used Henk Elffers, a law psychologist, as its statistician. He worked out the chance that so many incidents would fall on her shifts by luck: 1 in 342 million. There was no medical proof of murder. In 2003 a court in The Hague gave her a life sentence for four murders and two attempts, and the statistics were central to it.
The number was wrong. Metta de Noo, a doctor, grew uneasy about the case, and her brother Ton Derksen, a philosopher, wrote a book about it. Statisticians, Richard Gill of Leiden University among them, then reworked the arithmetic. On the same counts, with nurses allowed to differ, the chance comes to about 1 in 49.
A statistical test works like a jury. It presumes, it weighs, it demands, it declares a verdict, and it counts its charges. In the case against Lucia, each step went wrong in the same way. The test treated a hospital ward as a pile of separate events.
A ward is a system. Donella Meadows defined one as “an interconnected set of elements that is coherently organized in a way that achieves something.” On a ward, the elements, or parts, are the nurses, the patients and the shifts. The interconnections, the ties between them, are the handovers, the shared patients and the rota that decides who works which shift. The function, or purpose, is caring for very sick children, and some of them die whoever is on duty. A test that cuts the interconnections counts the wrong thing.
In September, three days after my second daughter was born, I thought we would go home that day. My systolic number ran past 140, and I was flagged with gestational hypertension, high blood pressure from pregnancy. The American College of Obstetricians and Gynecologists draws its line at 140 on top or 90 on the bottom, on two readings at least four hours apart. My daughter went home. I stayed one extra night, and a cuff squeezed my arm every three hours. I kept crying. I did not understand, and I was scared of preeclampsia, a more dangerous high blood pressure. At 5 a.m. my blood was drawn.
If one rare number could send a nurse to prison for life, what does a test check before a cuff keeps a mother in the hospital one more night?
What the Jury Presumes
Elffers’s table for the children’s ward had four boxes. Over the months he studied, the ward ran 1,029 shifts, and Lucia worked 142 of them. The ward logged 8 incidents, and all 8 fell on her shifts.
Before that table could say anything, Elffers had to presume something: that Lucia was like any other nurse, and incidents land on shifts by chance. A jury starts there too: innocent until proven guilty. Statisticians give the starting guess a name.
“A statistical test provides a mechanism for making quantitative decisions about a process or processes. The intent is to determine whether there is enough evidence to “reject” a conjecture or hypothesis about the process. The conjecture is called the null hypothesis.”
Elffers checked his guess with Fisher’s exact test, which asks how often chance alone would put so many incidents on one nurse’s shifts. It is the test built for a woman tasting eight cups of tea.
His starting guess carried a second one inside it: the elements stand alone. Each shift was a fresh draw, like a coin flipped again, with no memory of the shift before. Russell Ackoff described a system as “a whole that cannot be divided into independent parts.” A sick baby’s bad night carries into the morning shift, and one admission changes the work of everyone on the floor.
When a team misses two deadlines in one month, the fair starting guess is that no one person caused them. The second guess hides there too: two misses that wait on one late handoff are one miss counted twice. At the next meeting, before anyone is named, someone can ask what the misses had in common.
A jury also weighs the evidence, and Elffers had more than one ward to weigh.
What the Jury Weighs
Elffers had three tables, not one. Lucia had also worked two wards of the Red Cross Hospital, numbered 41 and 42.
| Ward | Shifts | Her shifts | Incidents | On her shifts |
|---|---|---|---|---|
| Children’s hospital | 1,029 | 142 | 8 | 8 |
| Red Cross, ward 41 | 366 | 1 | 5 | 1 |
| Red Cross, ward 42 | 339 | 58 | 14 | 5 |
He tested each ward on its own, then multiplied the three answers. Multiplying chances is the arithmetic of separate events: two fair coins both land heads one time in four. Gill and his co-authors Piet Groeneboom and Peter de Jong pointed to the “absurd consequence”: by that arithmetic, a nurse grows guiltier each time she changes hospitals. Read as one table of 1,734 shifts, the same test gives about 1 in 3.8 million.
The bigger change came from the interconnections, what the shifts shared. On any ward, Gill wrote, events come “strongly clustered.” Nurses with different training “do get different shifts.” A ward lives through winter and summer, and through changes in who gets admitted. Each of those is a cause that many shifts share, and shared causes make clusters with no one to blame. How large those clusters run on an ordinary ward, Gill noted, no one had yet measured. Let each nurse’s rate of incidents differ, and the chance of her 14 incidents drops to that 1 in 49 (Figure 2).
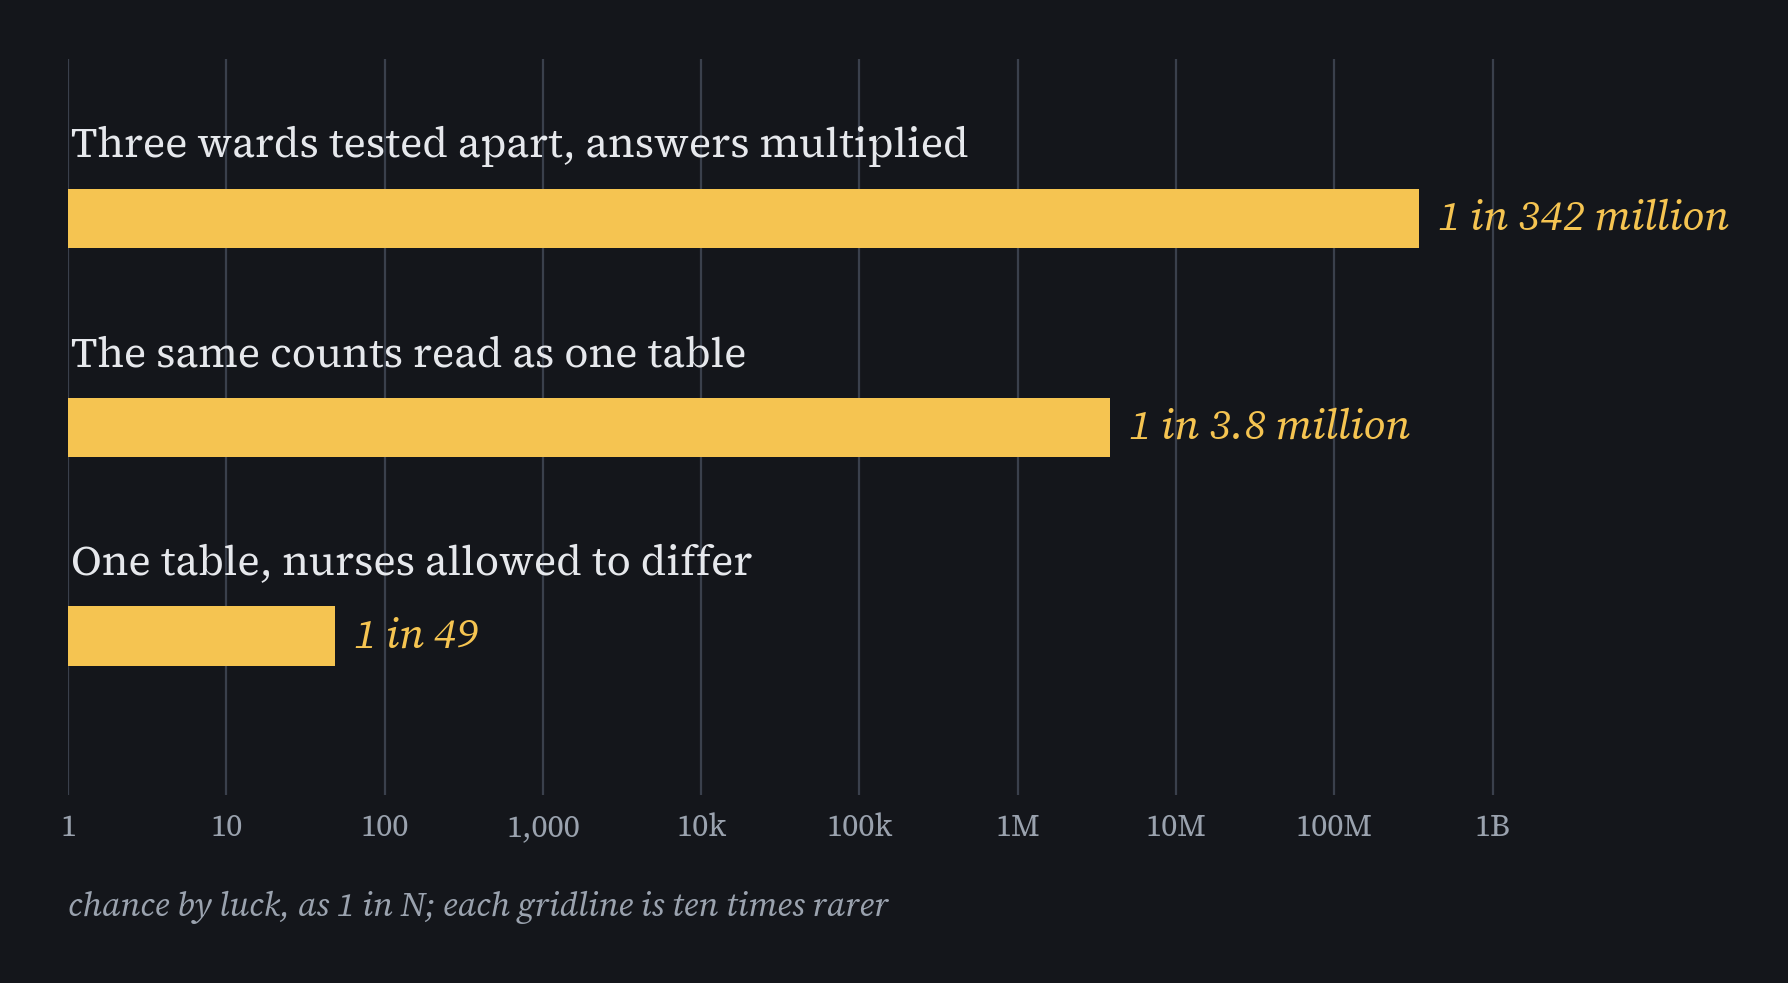
Figure 2. One ward table, three answers. The same 27 incidents and the same 14 on her shifts, counted three ways; each gridline is ten times rarer than the one before. The first two bars were rerun for this piece from the table and match the published figures; the third is Gill, Groeneboom and de Jong’s. Drawn for this piece.
In 1926, Ronald Fisher drew the first blocks of a randomized field trial, to handle shared causes. Each block was a line around a patch of shared soil, with every treatment tried once inside it, so comparisons stay within the patch. A fair test builds the shared soil, or the shared winter, into its comparison before it weighs anything.
A child’s grades have shared causes too: one teacher for the whole year, and a heater that rattled through every February test. Before reading a drop between two terms as the child’s doing, a parent can ask what changed for the whole class.
Weighing gives a number. A jury still needs a line for that number, drawn before anyone counts the incidents.
What the Jury Demands
In the case file, an incident was whatever the hospital called one. Gill and his co-authors found incidents “relabeled without clear reasons,” and a data collection that “rested for a large part on memory.” Staff searched the records after the bad feeling, knowing whom they were looking for. “Incidents outside shifts of Lucia were discarded.”
The search fed itself. A death no one could explain became suspicious if Lucia had been present. In two cases, by Gill’s account, a single expert called a death unusual because Lucia had been there. Each new suspicious case made her presence look more meaningful, which sent the search back through more records. The search was an interconnection too. Meadows called this kind of circuit a self-reinforcing feedback loop: each turn of it feeds a larger next turn (Figure 3).
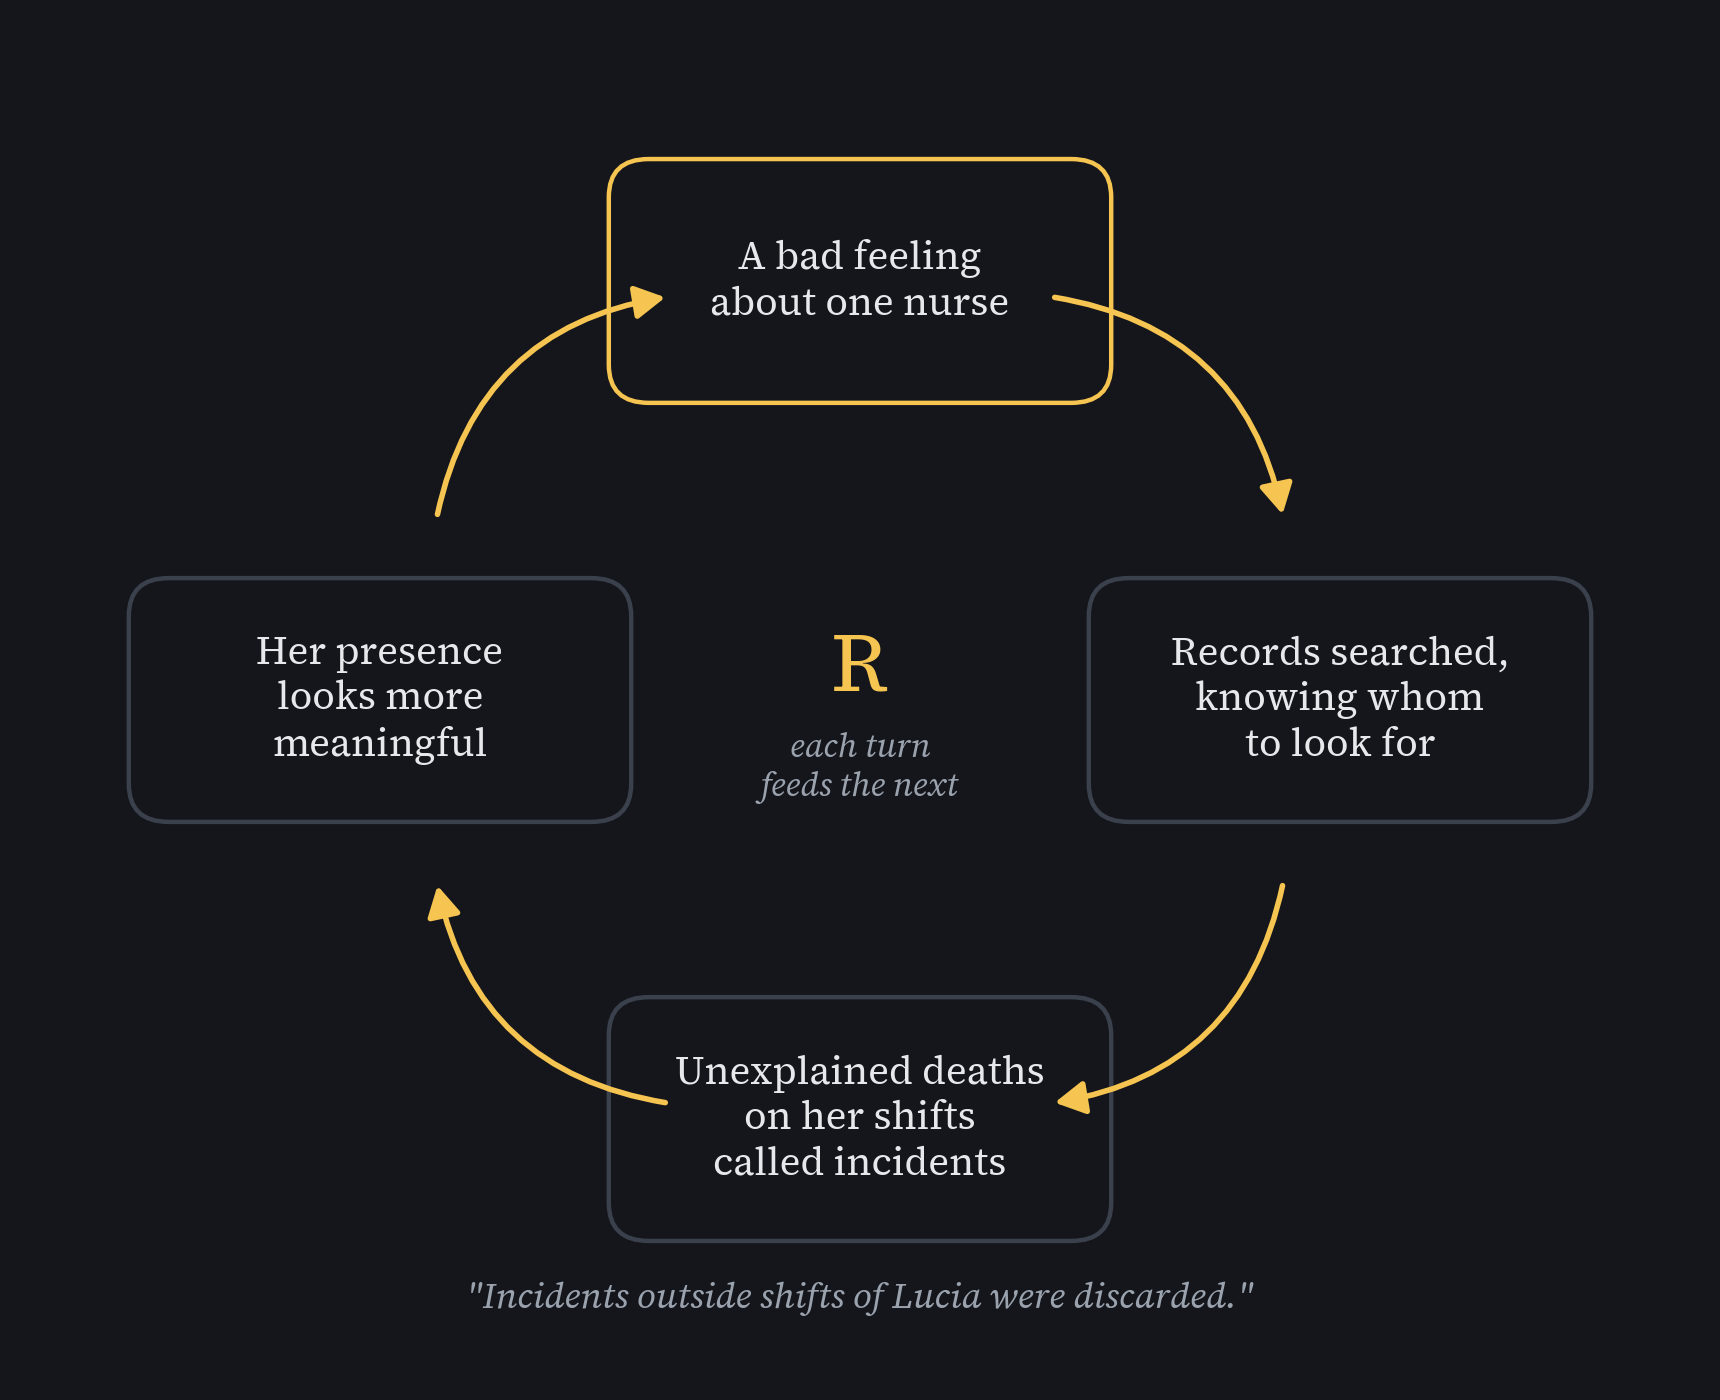
Figure 3. The search fed itself. Each turn made the next search look more justified, and incidents on other nurses’ shifts were dropped along the way. Steps as Gill, Groeneboom and de Jong describe them; the loop is this piece’s reading. Drawn for this piece.
A jury demands proof beyond reasonable doubt. A test writes that demand as a line drawn before the evidence comes in, set so that it rarely convicts the innocent. The obstetricians’ line asks for two readings four hours apart, so one bad hour is not enough. Convicting the innocent has a name, a Type I error. The line guards against it only when the evidence was gathered blind. Evidence gathered inside the loop had already passed through the suspicion it was meant to test.
The same loop can run at work. A manager who opens a red folder on one employee after a bad feeling writes down each of that person’s late emails and never counts anyone else’s. Left to the loop, the folder fills with one name. The fair version draws the line first: what counts as late, written down before anyone looks, checked for the whole team.
Even a line drawn fairly gives only a pass or a fail. What a pass means is a separate claim, and Elffers had to make it in court.
What the Verdict Declares
Elffers told the court: “Your honour, it was not chance. The rest is up to you.” He meant the cluster was unlikely to be bad luck, and he stressed that it did not prove cause: Lucia might work harder shifts, or be set up. It was easy to hear something else: a 1 in 342 million chance that she was innocent.
A chance of the evidence and a chance of innocence are different numbers. A test’s p-value gives the chance of evidence this extreme if the starting guess is true. It never gives the chance that the guess is true. A rare result works like a rare hand at cards, slapped down on the table: the hand does not prove the dealer cheated, and other explanations stay open. The statistician Peter Donnelly walks a TED audience through the same mistake, made in a British court (Figure 4).
Figure 4. How a rare result gets misread as a rare chance of innocence, from Peter Donnelly’s TED talk (2005, twenty-two minutes).
Meadows ranked a system’s function above its elements and interconnections, and the ward’s function is one of the other explanations a rare hand leaves open. A ward for very sick children sees deaths that come whoever is on duty, and each one still falls on somebody’s shift. A test that never asks what the ward is for reads every death as a clue.
“Not chance” also turned a measure of surprise into a yes or no. That move joins two rival ways of testing: a p-value read beside a line drawn first.
In 2004 the appeals court said its verdict did not rest on statistics. It convicted her of seven murders and three attempts. Gill’s team showed the verdict still leaned on incidents judged “very improbable,” and only one or two murders had to be proven on their own.
True-crime shows and jury rooms meet the same mistake. An expert says only 1 person in a million would match the evidence. A city of two million still holds about two other people who match. A juror can ask how many people could have matched, and why this one was charged.
A trial with many charges is harder, and so is a ward with many nurses.
What the Jury Counts
Twenty-seven nurses worked the children’s ward. Elffers multiplied his children’s ward answer by 27, to allow for the chance that one of them, any one, would look unlucky. That is fair when the question comes first. Here the cluster came first. Gill’s team named the trap: “testing a hypothesis using the same data which suggested that hypothesis.”
The fairer question looks at the whole system. Across a country’s many wards, some nurse somewhere will have a run of bad shifts by chance alone. The bad feeling picked the part first and then asked how rare that part was. A test that starts from the whole asks how often some nurse, on some ward, would look this unlucky.
Every count has a boundary, and Elffers’s tables took in her wards, during her months. The hospital director had renamed the children’s ward, and he never told the investigators that two years before, under its old name, it had logged even more incidents. Drawn two years wider, the boundary would have held a bigger cluster than hers.
A blood panel asks many questions at once. Each normal range holds about 95 of every 100 healthy people. Across 20 unrelated ranges, that leaves about two healthy people in three with a flag. Those 5 a.m. draws were a panel of 18 results, and the first came back with six stars, one beside each number outside its range (Figure 5). The next morning it had four. The enzyme AST came back into its range, and total protein lost its star by a tenth of a point. My 18 numbers were never 18 separate questions. Each morning they came from one body, the way Lucia’s incidents came from one ward. When a sheet comes back starred, the question is how many ranges were checked, and what the starred numbers share. A parent holding a child’s starred sheet can ask both questions.
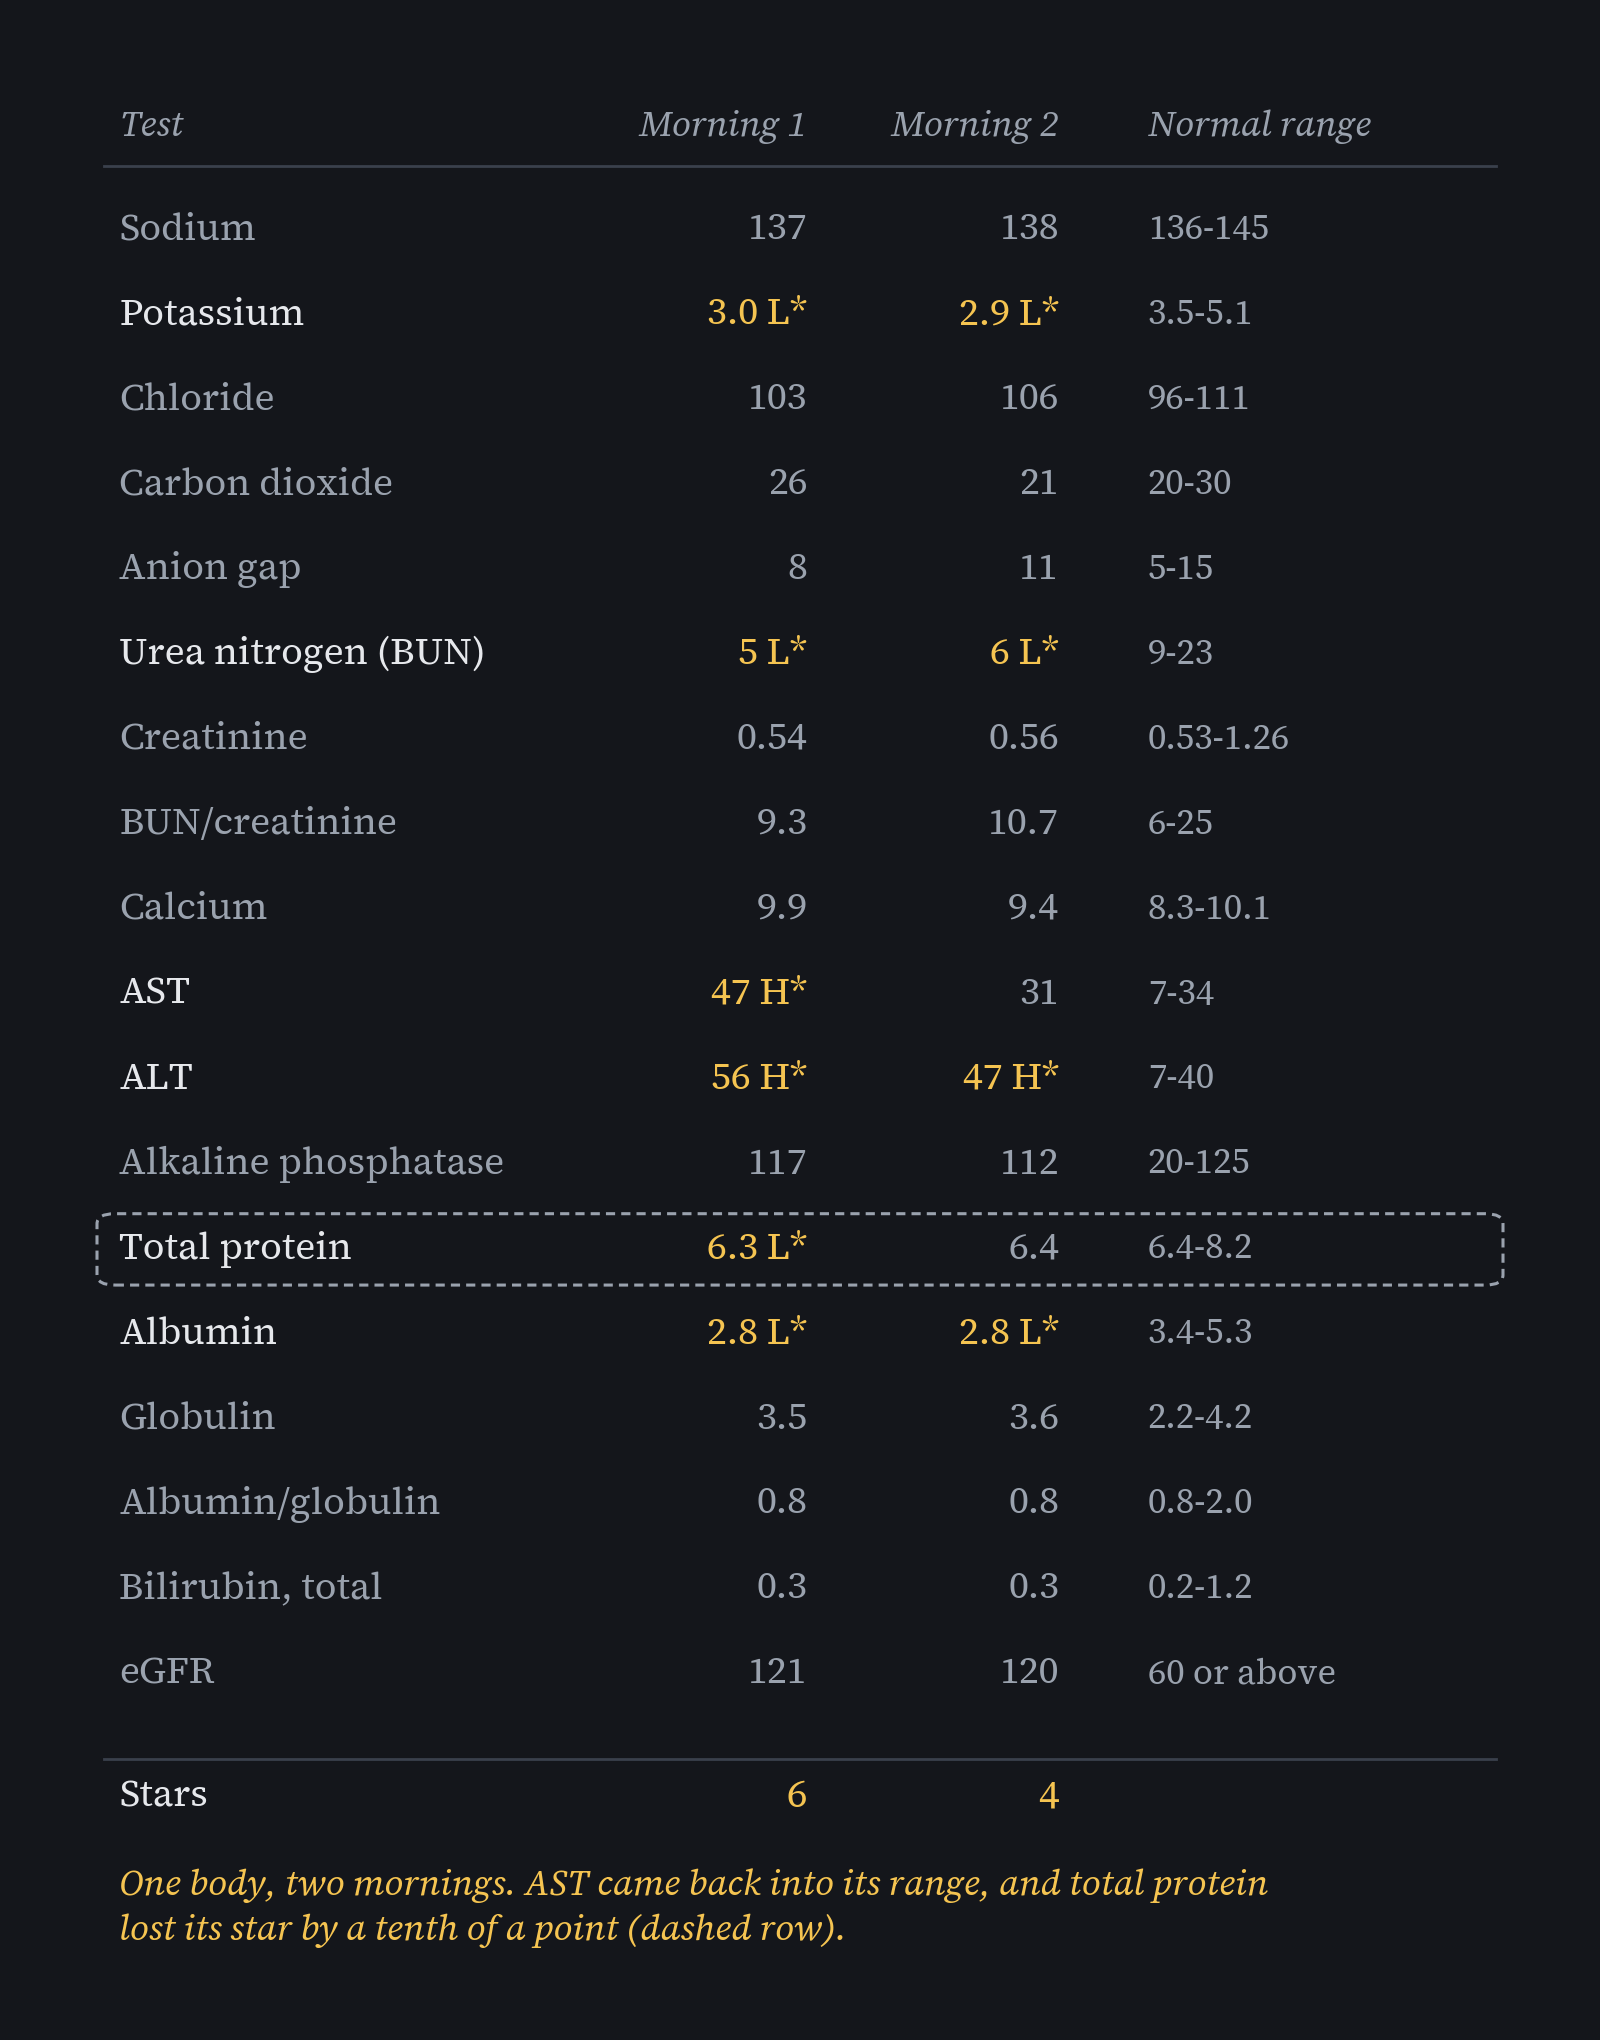
Figure 5. Six stars, then four. My own metabolic panel on two mornings in September 2026, a day apart, with the lab’s normal ranges; names, dates and record numbers left out. Redrawn for this piece.
On April 14, 2010, a court acquitted Lucia de Berk of every charge. The deaths were found natural. She had spent six years in prison. She died in 2025, at 63. The ward had been a system all along, and the spreadsheet had a column for only one nurse.
A Closing Invitation. The bad feeling stood for a test that knew its answer before counting. A fair test treats a ward, a night of readings or a body as a system, with parts, ties and a purpose, and draws its line first.
- Flip the odds. Right now, recall the last true-crime show or podcast whose odds, “1 in a million,” left you sure, within the hour, the suspect did it. Say those odds out loud two ways: the chance of the evidence if the suspect was innocent, then the chance they were innocent. Which one would convince you on a jury?
- Count the other columns. This week, think of the coworker or classmate whose name comes up whenever something goes wrong, like the last missed deadline or the shared fridge that began to smell. How many others were there each time, and did anyone write their names down too? Was the pattern counted before or after someone was worried?
- Write down what nothing looks like. Before the cuff’s squeeze next week, write two lines in a note: what “nothing changed” would look like, and which readings share a cause, mornings with mornings. Whoever drives you to checkups, if anyone, can help. Can one rushed Monday still decide a pill?
A bad feeling is worth saying out loud. Before anyone counts it, the spreadsheet needs a line drawn first and a column for every nurse on the ward.
A fair test is a jury for numbers: innocent until proven, weighed against chance, judged by a line drawn before anyone speaks. Skip a step, and the numbers will convict the coworker you were already watching.
Where This Came From
Read as a system, the case opens a set of four on how a test decides. The others are tea cups for the null and the p-value, a courtroom of witnesses for the line, and the seam where two schools met.
Intellectual Honesty Note. The jury is this piece’s image; the Dutch court that heard the case was three judges. The ward table is Elffers’s data; Lucia in fact worked three shifts on ward 41, not one, and later corrections moved and added incidents. The 1 in 49 comes from Gill, Groeneboom and de Jong’s model and was not rerun here. Counting shared causes such as the seasons among the interconnections, reading the search as a feedback loop and reading the earlier cluster as a boundary are this piece’s framing. The sick baby’s night, the admission, the card hand, the office deadlines, the report card, the manager’s folder and the city of two million are this piece’s examples, not events from the case. The two-in-three for a blood panel assumes unrelated ranges, which real panels are not. Figure 5 is my own two panels; glucose is left out, since its range assumes a fasting sample. Reading their stars as sharing a cause is this piece’s framing, not a diagnosis. The hospital days are mine; the threshold is ACOG’s.
References
Ackoff, R. L. (2015, November 2). Systems thinking speech by Dr. Russell Ackoff [Video]. YouTube. https://www.youtube.com/watch?v=EbLh7rZ3rhU
American College of Obstetricians and Gynecologists. (2020). Gestational hypertension and preeclampsia (ACOG Practice Bulletin No. 222). Obstetrics & Gynecology, 135(6), e237-e260.
Doles, N., Mon, M. Y., Shaikh, A., Mitchell, S., Patel, D., Seehusen, D., & Singh, G. (2025). Interpretating normal values and reference ranges for laboratory tests. Journal of the American Board of Family Medicine, 38(1), 174-179. https://www.jabfm.org/content/38/1/174
Donnelly, P. (2005). How stats fool juries [Video]. TED. YouTube. https://www.youtube.com/watch?v=kLmzxmRcUTo
Fisher, R. A. (1926). The arrangement of field experiments. Journal of the Ministry of Agriculture of Great Britain, 33, 503-513.
Gill, R. D. (2009). Lies, damned lies, & legal truths: Making and breaking legal conviction [Lecture slides]. Mathematical Institute, Leiden University. https://pub.math.leidenuniv.nl/~gillrd/Lucia.pdf
Gill, R. D., Groeneboom, P., & de Jong, P. (2018). Elementary statistics on trial: The case of Lucia de Berk. CHANCE. Preprint: https://arxiv.org/abs/1009.0802
Meadows, D. H. (1999). Leverage points: Places to intervene in a system. The Sustainability Institute. https://donellameadows.org/archives/leverage-points-places-to-intervene-in-a-system/
Meadows, D. H. (2008). Thinking in Systems: A Primer (D. Wright, Ed.). Chelsea Green.
NIST/SEMATECH. (2012). e-Handbook of statistical methods. National Institute of Standards and Technology. https://www.itl.nist.gov/div898/handbook/
NL Times. (2025, August 31). Nurse wrongly convicted of killing 7 patients dies at age 63. https://nltimes.nl/2025/08/31/nurse-wrongly-convicted-killing-7-patients-dies-age-63