In 1914, Joseph Goldberger walked through an asylum where patients died and nurses did not. The asylum stood in Jackson, Mississippi, and many of its nurses slept on the wards. The patients had pellagra, which started as a rash, red and rough like a bad sunburn, on the backs of the hands and neck. Then came diarrhea, confusion, and for many, death. In under four years, pellagra had killed 98 patients there and not touched one nurse.
Goldberger was a federal doctor, and the South offered him three suspects. The first was a germ. A commission studying the disease in South Carolina judged it most likely an infection, spreading fastest where the sewage was handled worst. The second was spoiled corn. The third was a biting insect, the favorite of an expert in London. Each suspect would have struck anyone who shared the asylum’s wards.
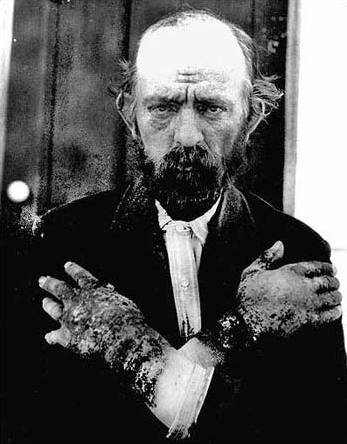
Figure 1. A man with pellagra, photographed by Dr. James W. Babcock, who ran South Carolina’s state asylum. The rash on the backs of the hands is what the Jackson patients had and the nurses did not. National Institutes of Health History Office, courtesy of the Waring Historical Library, Medical University of South Carolina, via Wikimedia Commons; public domain.

The asylum’s own doctor told Goldberger of one patient who fell ill after 15 years inside and another after 20. Whatever caused pellagra was working within the walls. Yet the asylum had hired 126 nurses and attendants since 1909. Of them, Goldberger wrote, “No case, so far as I was able to learn, has developed.” “If pellagra be a communicable disease,” he asked, “why should there be this exemption of the nurses and attendants?”
The difference was on the plate. The nurses ate from the same kitchen, but they took the best and the widest variety first, and they could buy more outside. The patients had no such choice. The next year, on a prison farm near Jackson, eleven healthy prisoners were promised pardons. In return, they ate a diet built on grits, cornbread and syrup for months. By November, six of them had the rash. In the spring of 1916, Goldberger and a few volunteers swallowed pills made from patients’ scabs and stool, and took injections of their blood. “We just feasted on filth,” he said. None of them caught pellagra.
The cause was in the kitchen, and the kitchen was set by the pay. Mill and sharecropper families in the South lived on cornmeal, fat pork and molasses, often bought on credit. No one isolated the missing vitamin, niacin, until 1937, eight years after Goldberger died. By the late 1940s, laws in Southern states required niacin in bread, flour and cornmeal, and pellagra had nearly vanished. The germ hunters had searched the patients’ bodies, and the answer sat on the plate across the table.
On a visit home you watch a parent carry the laundry basket down the basement stairs, one hand on the wall, nothing to hold. Whoever lives with them has stopped seeing the bare wall. More than one older person in four falls each year. The basket raises a question, and it is not whether a fall is coming. It is what comparison would show whether a rail, a class or a check would keep them on their feet. Without one, the fall arrives as the first reading anyone took, and the couch downstairs becomes the bed.
The woman this series has followed since twenty-five is sixty-six now. At fifty-five a scan read her hip at -1.8: thin, yet not thin enough for the word osteoporosis, so no one treated it. One February evening, in socks, she misses the third stair from the bottom, the one with nothing to hold, and lands on that hip. It breaks anyway. Medicare pays for the surgery the next morning. Nothing ever paid for a rail. A year after a broken hip, only 40 to 60 percent of people walk the way they did before.
The third part gave the body’s side its methods. This part asks what a house, a clinic and a bill can do for a body, the tree’s other half, and whether a method answers each question directly. Four questions hang there. Which cheap signals warn of decline before a first fall, and does finding decline sooner change anything? After a first fall, how do we break the loop of fear, moving less and weaker legs? Which changes to a home keep people on their own longest per dollar? And how do we pay for function kept rather than procedures done? Goldberger solved his case with two groups under one roof, alike in everything but the plate. Each of my four questions needs two groups like those. Who, in her story, are the nurses?
Before the First Fall
In the spring of 1927, the Mississippi River broke through its levees and flooded farms across the South. Families waited out the water in Red Cross camps, on rations heavy in cornmeal. Goldberger toured the flooded states and found pellagra spreading. On his advice, the Red Cross added brewer’s yeast, which supplies what cornmeal lacks. Within weeks, the sick were recovering and new cases stopped. The rations changed while the outbreak was still running.
A body gives warnings too, if someone takes the reading. A stopwatch and a few meters of floor can predict who will still be alive in ten years. Stephanie Studenski and colleagues pooled nine studies, about 34,000 older adults in all, whose usual walking speed had been timed. Take men of 75. About one in five of the slowest walkers was predicted to reach 85. Of the fastest, nearly nine in ten.
The walk is timed over 5 to 10 meters. Grip is measured by squeezing a handheld gauge, and a review of the measure calls it “a good simple measure of muscle strength” when the conditions are standard. Low grip predicts longer hospital stays, more trouble with daily tasks, and death. Both take a minute. Which cheap signals warn of decline in time to act, and how could they be checked as routinely as blood pressure? My questions on the tree’s other half start there (Q211, Figure 2).
Part two
Answerable questions
A walk needs a heart, lungs, nerves, muscles, joints and balance all at once, so a slow one cannot say which of them failed. In 2009, two physical therapists called walking speed “the sixth vital sign,” a number read, like any vital sign, against a person’s own normal. Like a smoke alarm, it says something is wrong in the house, not which room is burning. That makes it a good alarm and a poor diagnosis, and an alarm is checked two ways. A risk prediction model combines several readings, each with its own weight, into one probability of falling in the next year. Gait and grip at her checkups from fifty-five on would have been its inputs. At fifty-five the checkup read her blood, and nobody timed her walk.
“Algorithms (or risk prediction models) should give higher risk estimates for patients with the event than for patients without the event (‘discrimination’). The accuracy of risk estimates, relating to the agreement between the estimated and observed number of events, is called ‘calibration’.”
Discrimination asks whether the model ranks her above a neighbor who never falls. Calibration asks whether, of women it scores at 30 percent, about 30 in 100 fall. Both are checked the way the third part checked its levels, on people the model never saw. A model can rank well and still be miscalibrated for one group. The second part planted the case: in diabetes, a bone scan looks better than the bone. At any given scan reading, people with diabetes break more hips than a fracture model predicts. The scan that read -1.8 at fifty-five was reading her hip through her diabetes. In a fracture model, she is in the group for which the predicted breaks come out too few. A model wrong for her group is wrong in the direction that left her hip untreated.
The second part used a cheap signal at the end of a study, as a surrogate: a reading that substitutes for an outcome years away. A screen uses that signal at the start, and the start hides a trap. Suppose a timed walk flags her at 58 instead of 66, and nothing done in between changes the day she falls. Counted from the flag, she seems to live eight years longer with frailty, and not one of those years is new.
“A distortion overestimating the apparent time surviving with a disease caused by bringing forward the time of its diagnosis”
A fair count starts everyone at the same line, a birthday or the day a study began. Whether checking the walk routinely keeps people on their feet is a question for a trial, and one kind of trial is built for clinics. In a stepped-wedge cluster trial, clinics are assigned at random to the order in which they switch the check on. Every clinic ends up checking, and the early ones are the comparison for the late ones. Her clinic was scheduled to switch on in the spring after her fall. The clinics that switched on before hers were her nurses: a checkup like hers, with a stopwatch added.
A parent’s yearly checkup leaves a question for the drive home: was the walk timed, or only the blood read? Walking speed over a few meters is the number to ask for, and the cue is the visit itself. No one took a reading in her house, so the first one was the fall on the third stair. Would anyone count the second fall?
The Spring It Came Back
Pellagra came back in the spring, much as one fall invites the next. Someone who survived one attack often had another the next year. So when Goldberger changed the meals at two orphanages in Jackson in 1914, adding milk, eggs, beans and peas, he counted the second attack. At one, none of the 67 children past the anniversary of their last attack fell ill again. At the other, one of 105 did.
Her loop starts after the hospital. Six weeks after the surgery she is home, and the stairs frighten her, so she sleeps on the couch downstairs. Fear of falling, in the field’s words, is low confidence in avoiding a fall during the ordinary tasks of a day. It sets a reinforcing loop running. A fall leads to fear, and fear to moving less. Moving less leads to deconditioning, the strength a body loses to disuse, and weaker legs lead to the next fall. Breaking that loop after a first fall is my second question (Q212).
A count that stopped at the first attack would have missed Goldberger’s test. A loop needs a method that counts more than once, and many studies stop the clock at the first fall. A fall that happens again to the same person is a recurrent event, and every one has to be counted, over time, the way Goldberger counted the second spring. The difference shows in a review of 108 exercise trials in people over sixty living at home. Exercise cut the rate of falls by 23 percent, but the number of people who fell at all by only 15 percent. The 23 percent rests on the 59 trials that counted every fall. Fewer falls and fewer fallers are two answers, and the gap between them lies in the second and third falls, the ones a count of fallers never sees.
“Multistate models offer a versatile framework for studying such processes through the analysis of transition rates between different health states.”
A multistate model follows people as they move between steady, fallen, afraid and housebound, and sometimes back, and asks which move is easiest to block. The third part’s competing risk is a small multistate model: one starting state and two exits, with death as one of them. Here the moves multiply. In the spring after her fall she comes down the stairs for the mail, in shoes this time, and falls on the second step. That second fall is her recurrent event, and the model asks whether the move from afraid to housebound made that fall more likely. Her nurses would be people sent to an exercise class after a first fall, and the model would show which move the class slowed. Few fall trials report every move between states, so which move to target first is still open.
Whoever drives a parent home after a fall can ask two questions before leaving the emergency room. Which program does the hospital send people to, and who will call in two weeks? The two weeks after discharge is the window, and the discharge sheet is the cue. Without those answers, the couch downstairs is already the next state. A rail would have changed the stair, and the stair is the next question.
One Rail, One Dollar
A rail for her stairs takes a handyman an afternoon, two brackets per stretch of wall and a length of wood. In Chicago in 1995, the surroundings’ side of the healthspan question was a machine in a window, an air conditioner lowering what the heat asked of a body. At sixty-six it is a rail on a stair.
The second part put a grab bar from a program called CAPABLE beside the money it saved Medicare. CAPABLE is a complex intervention, its handyman, nurse and therapist sent as one bundle. Its result cannot say what the rail alone was worth. My third question asks which changes to a home keep people independent longest per dollar (Q221, Figure 3).
Part two
Answerable questions
Pulling CAPABLE’s three parts apart is a design question, and the design is older than the program.
“An alternative may be a factorial trial, where for two interventions participants are allocated to receive neither intervention, one or the other, or both.”
Four arms: the rail alone, the therapist alone, both, neither. The arm with the rail alone would be her nurses, the one result CAPABLE could never show, and the arm with neither is her, on the February evening. Then the “per dollar” needs its fraction. A cost-effectiveness analysis divides the extra cost of a change by the extra benefit it buys. The benefit is counted in health rather than money, so options can be set side by side as cost per outcome. For a rail, the top of the fraction is the afternoon’s work. The bottom is the second part’s disability-free life years, counted as years lived without needing help to bathe, dress or climb the stairs. Count the bottom as years alive instead, and the rail looks almost worthless, because most falls do not kill.
The steps in a parent’s home with nothing to hold are the count to take on the next visit. A rail’s price against a fall’s is the fraction in one line. The fraction still leaves out who pays. The rail is bought from one budget, and the surgery it saves comes off another. Whose budget pays is a question about the bill, not the house.
Paid for the Plate
A family that paid for enriched flour in 1945 got the vitamin without deciding to. The flour laws decided for them, and better wages put more on the plate. Pay had set the kitchen, and pay reset it. A system that paid for her surgery and never paid for her rail is set the same way.
Most American care is fee-for-service, a fee for each service performed, and keeping someone on her feet earns no fee. Paying for the quality of care instead, which the field calls value-based payment, would reward the rail. My fourth question is how to get there (Q222).
No trial can assign half a country to a new way of paying. But in 2019 a rule let Medicare Advantage plans, the private plans many people on Medicare choose, cover home safety changes such as stair rails. Some plans began to cover them, and others did not. That split is a natural experiment, the kind the third part found in Snow’s two water companies: the world, not a researcher, sorted people into two groups.
“To reduce confounding and support causal inference, DiD compares changes in outcomes over time between a “treated” group exposed to a policy change and a “comparator” group not exposed to the change. A fundamental underlying assumption, known as the parallel trends assumption, is that the treated and comparison groups would have had parallel outcome trends in the absence of the policy change.”
Count hip fractures among members of plans that started paying for rails, before 2019 and after. Do the same for plans that did not. The change in the first group, minus the change in the second, estimates what the rule did. Members of the paying plans would be her nurses: the same kind of stairs, a different plan card. The trap is that plans chose for themselves, and the ones that chose may have had healthier members. The years before 2019 are the check. If both groups were moving in step before the rule, a gap that opens after it is more likely the rule’s work. I have not found a study that has run this comparison yet. The cost of a fix shows up somewhere else, and here it shows up as a rail no budget owns.
The plan’s benefits booklet, when the enrollment mail comes in October, is where the question lands: does the plan pay for a rail or a grab bar? Between October 15 and December 7, people on Medicare can switch plans, and a daughter helping her mother choose can ask that one question before the premium. A plan chosen on its premium alone goes on paying for falls.
Each of the four questions now has its nurses. Each faces the same test as the body’s questions: what data to gather, which method, and whether that method gives a direct answer once the data are in. None of the data has to exist yet.
| Data to collect | Method | Answers directly? | |
|---|---|---|---|
| Q211 | Partly collected. Gait and grip at routine checkups, then falls and frailty over the next years, with diabetes recorded; clinics that switch the check on in turn | risk prediction model, checked for discrimination and calibration (design: stepped-wedge cluster trial) | Yes, in two steps: the model says who will fall; the trial says whether checking keeps people on their feet. Every outcome counted from the same age |
| Q212 | Partly collected. After a first fall, each state and the date of each move: fallen, afraid, moving less, housebound, a second fall, death | multistate model | Yes, if every state is recorded with its date |
| Q221 | Not yet. Costs and disability-free years in four arms: rail alone, therapist alone, both, neither | cost-effectiveness analysis (design: factorial randomized trial) | Yes, once the factorial trial exists; with bundle data only, the question splits again |
| Q222 | Partly collected. Which plans paid for rails before and after the 2019 rule, and their members’ function over the same years | difference-in-differences | Yes, if paying and non-paying plans’ members moved in step before 2019 |
Figure 4. The four surroundings questions, traced back to the data each one needs. “Partly collected”: some studies hold it, though no clinic gathers it routinely. Drawn for this piece.
Three versions of her close the question, and they are the first part’s figure drawn through one life. In the first, she fell on the third stair at sixty-six, and the couch downstairs was the beginning of her sick years. In the second, the fall came at seventy-two instead, and she spent the same years on the couch, only later. In the third, a timed walk flagged her at fifty-eight, she kept training, and a rail went in that spring. When the fall came it was one fall, and the years that followed were her own. The second version is delay. The third is compression.
The third version is exactly the comparison lead-time bias corrupts: counted from the flag at fifty-eight, she looks as if she lived longest with frailty. So count every version from the same birthday, as years without disability from fifty-eight on, the way the first part’s figure counts, by age and not by diagnosis. On that count the third version wins, and the count is one a statistician would sign.
A Closing Invitation. What the nurses ate stood for a cause, and a fix, outside the body: a stair, a missing check, a bill. In the versions of her, the gap closes when the sick years shrink, not when they move later.
- Right now, picture the stairs in your home or a parent’s, and count the steps with nothing to hold. Which step would you miss in socks? Would the plan card in your wallet pay for a rail beside it?
- If someone you love fell in the last year, ask them two things: which program the hospital sent them to, and who called two weeks later. Which of the two did no one mention?
- At this month’s checkup, yours or a parent’s past seventy, ask out loud: “Has anyone timed my walk? When will they do it again?” Which answer would change what happens before the next fall?
Her third stair has a rail now, and the years counted from fifty-eight are hers. The next piece counts years like hers for a whole country. In Jackson the fix sat on the nurses’ plate; in Chicago, beyond a shut window.
Where This Came From
Goldberger is remembered for the filth parties. His partner went on to something quieter. From 1921 to 1924, Edgar Sydenstricker’s team visited about 1,800 families in Hagerstown, Maryland, and wrote down every illness, not only every death. The Hagerstown study was one of the first American surveys to count how often a town was sick, and it grew into the National Health Survey. The healthspan gap rests on that idea: count the years spent unwell, not only the years alive.
Intellectual Honesty Note. The woman at sixty-six is invented. The February evening, the socks, the third stair, the couch downstairs, the second fall, the rail, her clinic’s place in the stepped wedge and the three versions of her are illustrations. The parent on the basement stairs and the closing’s scenes are too. The three versions are counted from the same birthday, as years without disability from fifty-eight on, which is this piece’s own device. Her miscalibration rests on a study of older adults with diabetes, which fits her at sixty-six better than at fifty-five. The list of three suspects is this piece’s device. Goldberger’s 1914 reading of the nurses’ plates was an inference from reports and visits. The prison farm and the orphanage diets came after, and “We just feasted on filth” is quoted from a secondary account. Reading the gap between fewer falls and fewer fallers as the second and third falls is my reading, not a claim the review’s authors make. The stepped-wedge trial, the factorial trial of the rail and the difference-in-differences study of the 2019 rule are designs drawn up here; none has been run. Walking speed and grip strength appear in plain words, not as definition boxes, from two reviews: Middleton, Fritz and Lusardi on walking speed, and Roberts and colleagues on grip. The answerability table names data to collect, not studies that exist.
References
Bryan, C. S., & Mull, S. R. (2015). Pellagra pre-Goldberger: Rupert Blue, Fleming Sandwith, and the “vitamine hypothesis.” Transactions of the American Clinical and Climatological Association, 126, 20–45.
Centers for Disease Control and Prevention. (2026). Facts about older adult falls. Retrieved October 8, 2026, from https://www.cdc.gov/falls/data-research/facts-stats/index.html
Centers for Medicare & Medicaid Services. (n.d.). Value-based programs. Retrieved October 8, 2026, from https://www.cms.gov/medicare/quality/value-based-programs
Centers for Medicare & Medicaid Services. (2018, April 27). Reinterpretation of “primarily health related” for supplemental benefits [HPMS memorandum].
Clay, K., Schmick, E., & Troesken, W. (2017). The rise and fall of pellagra in the American South (NBER Working Paper No. 23730). National Bureau of Economic Research.
Collins, G. S., Reitsma, J. B., Altman, D. G., & Moons, K. G. M. (2015). Transparent reporting of a multivariable prediction model for individual prognosis or diagnosis (TRIPOD): The TRIPOD statement. BMC Medicine, 13, 1. https://doi.org/10.1186/s12916-014-0241-z
Dyer, S. M., Crotty, M., Fairhall, N., Magaziner, J., Beaupre, L. A., Cameron, I. D., & Sherrington, C. (2016). A critical review of the long-term disability outcomes following hip fracture. BMC Geriatrics, 16, 158.
Fried, L. P., Tangen, C. M., Walston, J., Newman, A. B., Hirsch, C., Gottdiener, J., et al. (2001). Frailty in older adults: Evidence for a phenotype. Journals of Gerontology: Series A, 56(3), M146–M156. https://doi.org/10.1093/gerona/56.3.m146
Fritz, S., & Lusardi, M. (2009). White paper: “Walking speed: The sixth vital sign.” Journal of Geriatric Physical Therapy, 32(2), 2–5.
Goldberger, J. (1914). The etiology of pellagra: The significance of certain epidemiological observations with respect thereto. Public Health Reports, 29(26), 1683–1686.
Goldberger, J., Waring, C. H., & Willets, D. G. (1915). The prevention of pellagra: A test of diet among institutional inmates. Public Health Reports, 30(43), 3117–3131.
Goldberger, J., & Wheeler, G. A. (1915). Experimental pellagra in the human subject brought about by a restricted diet. Public Health Reports, 30(46), 3336–3339.
Goldberger, J., Wheeler, G. A., & Sydenstricker, E. (1920). A study of the relation of family income and other economic factors to pellagra incidence in seven cotton-mill villages of South Carolina in 1916. Public Health Reports, 35(46), 2673–2714.
Gorfine, M., Cook, R. J., Kragh Andersen, P., Therneau, T. M., Joly, P., Putter, H., et al. (2026). An overview and recent developments in the analysis of multistate processes. Statistics in Medicine, 45(10–12), e70493. https://doi.org/10.1002/sim.70493
HealthCare.gov. (n.d.). Fee for service. In Glossary. Retrieved October 8, 2026, from https://www.healthcare.gov/glossary/fee-for-service/
Hemming, K., Taljaard, M., McKenzie, J. E., Hooper, R., Copas, A., Thompson, J. A., et al. (2018). Reporting of stepped wedge cluster randomised trials: Extension of the CONSORT 2010 statement with explanation and elaboration. BMJ, 363, k1614. https://doi.org/10.1136/bmj.k1614
Kwok, C. S., Hinton, A. V., Lip, G. Y. H., Qureshi, A. I., & Borovac, J. A. (2026). Deconditioning in cardiovascular disease. Coronary Artery Disease. https://doi.org/10.1097/mca.0000000000001667
Medicare.gov. (n.d.). Joining a plan. Retrieved October 9, 2026, from https://www.medicare.gov/basics/get-started-with-medicare/get-more-coverage/joining-a-plan
Middleton, A., Fritz, S. L., & Lusardi, M. (2015). Walking speed: The functional vital sign. Journal of Aging and Physical Activity, 23(2), 314–322. https://doi.org/10.1123/japa.2013-0236
Montgomery, A. A., Peters, T. J., & Little, P. (2003). Design, analysis and presentation of factorial randomised controlled trials. BMC Medical Research Methodology, 3, 26. https://doi.org/10.1186/1471-2288-3-26
National Institute for Health and Care Excellence. (n.d.). Cost-effectiveness analysis. In NICE glossary. Retrieved October 8, 2026, from https://www.nice.org.uk/glossary?letter=c
Oke, J., Fanshawe, T., & Nunan, D. (2021). Lead time bias. In Catalogue of Bias. https://catalogofbias.org/biases/lead-time-bias/
Roberts, H. C., Denison, H. J., Martin, H. J., Patel, H. P., Syddall, H., Cooper, C., & Sayer, A. A. (2011). A review of the measurement of grip strength in clinical and epidemiological studies: Towards a standardised approach. Age and Ageing, 40(4), 423–429. https://doi.org/10.1093/ageing/afr051
Schwartz, A. V., Vittinghoff, E., Bauer, D. C., et al. (2011). Association of BMD and FRAX score with risk of fracture in older adults with type 2 diabetes. JAMA, 305(21), 2184–2192. https://pmc.ncbi.nlm.nih.gov/articles/PMC3287389/
Science History Institute. (n.d.). Joseph Goldberger’s filth parties. Distillations. https://www.sciencehistory.org/stories/magazine/joseph-goldbergers-filth-parties/
Sherrington, C., Fairhall, N. J., Wallbank, G. K., et al. (2019). Exercise for preventing falls in older people living in the community. Cochrane Database of Systematic Reviews, CD012424.
Studenski, S., Perera, S., Patel, K., et al. (2011). Gait speed and survival in older adults. JAMA, 305(1), 50–58.
Sydenstricker, E. (1925). The incidence of illness in a general population group: General results of a morbidity study from December 1, 1921, through March 31, 1924, in Hagerstown, Md. Public Health Reports, 40(7), 279–291.
Szanton, S. L., Xue, Q.-L., Leff, B., et al. (2019). Effect of a biobehavioral environmental approach on disability among low-income older adults: A randomized clinical trial. JAMA Internal Medicine, 179(2), 204–211.
Thompson-McFadden Pellagra Commission. (1914). First progress report of the Thompson-McFadden Pellagra Commission of the New York Post-Graduate Medical School and Hospital. Republican Publishing Company.
Tinetti, M. E., Richman, D., & Powell, L. (1990). Falls efficacy as a measure of fear of falling. Journal of Gerontology, 45(6), P239–P243. https://doi.org/10.1093/geronj/45.6.p239
Van Calster, B., McLernon, D. J., van Smeden, M., Wynants, L., & Steyerberg, E. W. (2019). Calibration: The Achilles heel of predictive analytics. BMC Medicine, 17, 230. https://doi.org/10.1186/s12916-019-1466-7
Wang, G., Hamad, R., & White, J. S. (2024). Advances in difference-in-differences methods for policy evaluation research. Epidemiology, 35(5), 628–637. https://doi.org/10.1097/EDE.0000000000001755
Watson, V., Tudur Smith, C., & Bonnett, L. J. (2024). Systematic review of methods used in prediction models with recurrent event data. Diagnostic and Prognostic Research, 8, 13. https://doi.org/10.1186/s41512-024-00173-5
Wilcox, L. S. (2005). Old black water. Preventing Chronic Disease, 2(Special issue). https://www.cdc.gov/pcd/issues/2005/nov/05_0191.htm