On July 14, 1995, Chicago’s medical examiner ran out of room for the dead. The day before, the thermometer at Midway Airport had read 106 degrees. On an ordinary night, his office took in about 17 bodies. That day it took in 87, and the office asked the state for refrigerated trucks to hold the rest. Many of the dead were found in rooms where the windows had been shut and locked all week.
Most of them were old, and many lived alone on the upper floors of apartment buildings. They were more afraid of a stranger breaking the glass than of the air they were breathing. By the end of the week, about 739 more people had died in Chicago than in a normal July week.
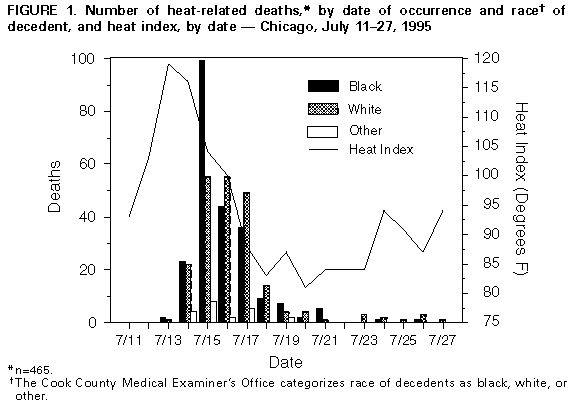
Figure 1. Deaths the Cook County medical examiner certified as heat-related, by day, Chicago, July 11 to 27, 1995, with the heat index above them. The count rose from 49 on July 14 to 162 on July 15, two days after the heat peaked. Centers for Disease Control and Prevention, Morbidity and Mortality Weekly Report 44(31), 1995. A United States government work, public domain.
Then the arguing started, and each person who looked at the dead saw a different killer.
The medical examiner, Edmund Donoghue, saw heat. His office certified 485 deaths that week as heat-related. It counted anyone found with a body temperature of at least 105 degrees, or in a home hot enough to explain the death. Epidemiologists from the Centers for Disease Control saw sickness. They interviewed the families and neighbors of 339 of the dead, then did the same for 339 living people matched by age and neighborhood. The people who died were more often already ill, living alone, and rarely out of the house. People with a working air conditioner had about a third of the odds of dying.
A sociologist named Eric Klinenberg saw the street. He spent years walking the West Side and found two neighborhoods, side by side, equally poor, with very different summers. North Lawndale lost 19 people. Little Village, next door, lost 3. Little Village had busy sidewalks and open shops, and its people had reasons to be out and to notice who was missing.
So which one killed them? Each answer is true, and each matches the job of the person giving it. The fourth killer was in every report and in no one’s job title: the locked window. The killer was the four of them together: a sick body, in a hot room, behind a locked window, above a street where no one walked by. “What killed them?” has four true answers, so it cannot be answered as asked.
Sit for a moment in the chair at your next checkup, this month or the one after. The clipboard is on your knee, the pen is on its chain, and whoever drove you there waits by the door. The intake form gives each condition its own line, and each line has its own doctor. Nobody adds the lines up. When I reran the World Health Organization’s numbers, the years a person spends unwell at the end of life came to about 9.3 in the median country in 2021. In the United States, they came to about twelve and a half. Those are the years waiting at the end of yours. Can those nine or twelve years shrink, or can they only move later? The form will not say. The lines stay apart, and so do the doctors.
Researchers call those years the healthspan-lifespan gap: life expectancy minus the years lived in good health. The dead in Chicago were already ill, living alone and rarely out of the house: they were living their gap years when the heat came. Of all the questions in biostatistics, how to narrow that gap is the one I keep coming back to. I want to answer it with my training as a statistician, and to teach myself the biology and medicine it takes. My rerun gave a country’s number, not a person’s. No one can be followed from birth to death with their health measured all along. So each country builds the gap from a table of this year’s death rates by age and this year’s share of each age group in poor health. The table applies those rates to a made-up group of newborns, as if the rates held for a whole life. The gap is real, and no one lives that average life. My question starts where the table stops, inside one life.
A question is answerable when it is stated precisely enough to name what it is asking for. A study that could actually be run can be designed for it. The data can be collected and analyzed. And the result is the thing the question asked about, not a stand-in for it. “How do we narrow the gap?” is none of these. Like the question about the dead in Chicago, it has to be split before any study can touch it. The dead show where to split it. The sick body is one side. The hot room, the locked window and the empty street are the other, and a working air conditioner was the clearest help on that side. A life could have been saved on either side. One woman, met at twenty-five in the first section, carries that split through all four parts of this series. The first thing to settle is why the usual plan for the gap barely moves it.
Delay, Done Whole
In 1990, three researchers asked what would happen to American life expectancy if cancer disappeared overnight. S. Jay Olshansky and his colleagues did the arithmetic. Life expectancy at birth would rise by a little over three years.
Three years sounds small for a cure that has never existed. The reason is that every person faces several causes of death at once, and only one of them can come first. A person spared cancer dies of heart failure or a stroke, a little later, sometimes after the same slow years of decline.
Causes that compete work like a roof with four leaks. Patch the biggest one, and the rain still comes in through the other three. The floor still rots, only a little later. The comparison stops at one point: leaks are separate holes, and diseases are not. They share causes.
Olshansky’s arithmetic leans on the opposite assumption: that the causes of death are independent, so removing one leaves the others as they were. In 1975, the statistician Anastasios Tsiatis showed that this assumption cannot be checked from deaths alone. For any set of causes that share roots, a set of independent causes exists that leaves an identical record of who died of what, and when. Deaths make poor witnesses: each one is counted under a single cause and keeps quiet about the rest. A table of causes of death cannot tell four separate holes from one rotting beam.
That point is where the gap becomes my problem as a statistician. For a classically trained statistician, one of the quintessential questions is how to model dependence: among variables, in networks, across processes over time. Books like Martin Crowder’s Multivariate Survival Analysis and Competing Risks teach the analysis side. What I want to know is what data could do what deaths cannot. Which measures, taken while people are still well, would show the shared causes before any single disease gets its name? So the question has to move from how people die to what can be measured while they are still living.
An earlier essay gave five definitions of a system. Russell Ackoff’s fits a body best: “a system is a whole that cannot be divided into independent parts.” In grade school, the body arrived as a list of systems, and the tests asked about the parts: the four chambers of the heart, the road from mouth to colon. The immune system turns out to be a system in the full sense. The gut does its work with help from bacteria that appear on no chart of the organs. A body is a system of systems, each one changing the others.
Medicine gets better at the parts every year. About two in three people on Medicare, the US health plan that covers most people over 65, live with more than one chronic condition. Each condition comes with its own specialist and its own best drug. Doctors have a name for what can happen next. A side effect of one drug gets mistaken for a new disease, and a second drug is prescribed to treat it. They call it a prescribing cascade. Every prescription is correct for the organ in front of the doctor who wrote it. The person filling the weekly pill organizer, seven little plastic doors snapping shut, is worse off. Making each part better does not have to make the whole better.
Whoever fills a parent’s pill organizer can look for a prescribing cascade. The cue is the intake form at the next checkup, one condition to a line. Does anyone in the room add the lines up? The thing to count is the doctors’ names seen in a year. The question for the pharmacist: could this new pill be treating a side effect of that one? An earlier essay quoted the first of Peter Senge’s laws: “Today’s problems come from yesterday’s ‘solutions.’” Not every problem starts as a fix, but a cascade does. So did the locked windows in Chicago: a fix against burglars that kept the heat in.
Picture a woman of twenty-five. Her periods come every two or three months, then not at all, along with acne and hair where she does not want it. A gynecologist puts her on the pill. A dermatologist treats her skin. A third doctor weighs her, reads 27 on the body mass index chart, and tells her to lose weight. Each does the job well, the way each expert in Chicago did, and none of them names the one condition behind all three complaints: polycystic ovary syndrome, PCOS. Nearly half of women with PCOS see three or more health professionals before anyone names it. A third wait more than two years. Up to seven in ten have never been diagnosed. The name a problem gets says more about who is looking than about the problem.
The years before the name count as morbidity: having a disease or a symptom of one, before anyone has written the disease down. The gap is widest for her: women spend about a quarter more of their lives in poor health than men do. On podcasts, I have heard women with PCOS talk about what that wait did to their mental health. When the name comes, it comes with a prescription for metformin, a diabetes drug, because PCOS makes the body resist its own insulin. At twenty-five she takes the metformin for her periods.
Much of what makes the late years hard never becomes a diagnosis at all: the slow loss of muscle, the tiredness, the hearing that fades at a loud dinner table. A list of diseases has nowhere to put them. They belong to what the organs share. The physician Peter Attia puts four diseases on one list because of what they share. He calls them the Four Horsemen: heart disease, cancer, Alzheimer’s and its relatives, and type 2 diabetes. He writes that “the odds are overwhelming” that one of the four is what a person dies of, and he builds his case for a longer life on delaying them.
The delay has to beat death to count. Push a first heart attack back five years while death moves back just as far, and a person gains five healthy years. The sick stretch at the end stays just as long. In 1980, the physician James Fries named the better outcome the compression of morbidity. It squeezes the sick years into a short stretch at the very end, the way a spring gets pressed into a smaller space (Figure 2).
“healthspan is the period of life spent in good health, free from the chronic diseases and disabilities of aging”
“The Compression of Morbidity hypothesis—positing that the age of onset of chronic illness may be postponed more than the age at death and squeezing most of the morbidity in life into a shorter period with less lifetime disability—was introduced by our group in 1980.”
Typical Trajectory enters Poor Health at
Extended Healthspan enters Poor Health at
Extra years spent out of Poor Health
| Stage | Typical | Extended |
|---|
Figure 2. Delay against compression, on two made-up lives. Drag either curve: a decline squeezed into a short stretch at the end adds healthy years, while a curve that only slides later carries the same sick stretch with it. The curves are hand-drawn, not fit to data. Drawn for this site.
Healthspan is a person’s. The gap in my rerun is a country’s, built from healthy life expectancy. That is the years a newborn could expect to live in full health if today’s death rates and rates of poor health held for its whole life. The World Health Organization builds it by Sullivan’s method, the made-up group above. Lifespan, at that level, is plain life expectancy, that table without the health column. A country’s gap can narrow by compression or by delay, and the table cannot tell which.
Delay aimed at one disease at a time runs into the leaking roof. Attia argues that metabolic trouble feeds the other three. In his account, insulin that stops working well, fat packed around the organs, and the low, steady inflammation they bring all raise the risk of more than one Horseman. The four diseases work like four branches of one tree. Prune one branch, and the other three keep growing. Starve the root, and all four thin at once. The comparison stops here too: a tree has one root, and the four diseases share several, some still unnamed.
No trial has shown, in people, that a treatment aimed at what the four share squeezes the sick years shorter, rather than only sliding them later. Part of the reason is what trials count. A trial that stops at a first heart attack or a death never sees the sick stretch at all. Telling compression from delay means following people for years and counting the healthy years and the sick ones separately. The two counts can move apart: more life with the same sick years, or the same life with fewer. I want to know how to design a study that can tell compression from delay well before its subjects die. Deaths will not say. Only the living can show which.
What the Body Can Do
Two bags of groceries, carried up one flight in a single trip. A chair stood up from without a hand on the armrest. A name found in the crowd at a loud dinner. These are what a body does on its own, and in 2015 the World Health Organization gave the sum of them a name: intrinsic capacity. The WHO splits it five ways: moving, energy, thinking, mood, and the senses.
“The composite of all the physical and mental capacities that an individual can draw on.”
Capacity is what a body could do. What a person actually does on an ordinary Tuesday, the WHO calls functional ability, “the capabilities that enable all people to be and do what they have reason to value.” It comes from capacity meeting surroundings. At twenty-five, the woman from the first section can draw on her full capacity: the stairs, the chair, the dinner table. The insulin resistance behind her diagnosis does not yet show in anything she does.
That gives the healthspan question its first branch. One way to gain a healthy year is to slow the decline of what a body and mind can do alone (Q1, Figure 3). The other way starts outside the body, and the figure shows both.
The question
Functional ability: capacity and environment
The body’s side is the one medicine already works on, and the one the tree’s root belongs to. Strong legs at eighty are part of the root. The thing to look for, in a parent or in oneself, is the task that now takes two tries. The shopping that used to come up in one trip now comes up in two. The chair needs a hand. The cue is the weekly shop, something the reader may be carrying up the stairs right now. Counting the trips is a first measure of capacity, taken years before any diagnosis. Four flights up with no elevator, though, even strong legs may not carry a person to the street.
Opening the Window
Two women have equally weak legs. One lives in a ground-floor flat next to a bus stop and runs her own errands. The other lives four flights up with no elevator and has not been outside in a month.
The two women have the same capacity and very different Tuesdays. No test of their cells could tell them apart: even a map of every layer inside a body stops at its edge, where the organism meets the world around it. The psychologists M. Powell Lawton and Lucille Nahemow drew that edge in 1973. They called what the surroundings demand of a person environmental press. What the person brings to meet it, they called competence: health, functioning, and the people and means they can call on. When the two match, a person lives comfortably and does what they set out to do. They called the match person-environment fit.
“The environment around an individual creates demands or strains, also referred to as environmental press.”
“According to Lawton and Nahemow’s ecological theory of aging (ETA), the performance of and comfort with daily necessary and desired activities is possible when an appropriate match between a person and his/her environment is achieved. This match, or zone of maximum performance and comfort, is known as person-environment (P-E) fit.”
The fit works like a window. Glass separates two sides, and the light that gets through depends on both. So the other way to gain a healthy year is to shrink the mismatch between what a person can do and what their surroundings demand (Q2). That means lowering the press until it meets the competence a person still has. Four flights of stairs is press. A bus stop moved two blocks away is press. An air conditioner in a window in July is press lowered by a machine.
Chicago had both sides at once. The CDC study found that the dead were more often ill, the body’s side. It also found they were more often alone and rarely went out, and that a working air conditioner went with lower odds of dying, the surroundings’ side. Families and neighbors answered for the dead, so those answers are secondhand. Klinenberg’s two neighborhoods point the same way, though a comparison of two places cannot prove the street saved anyone.
An earlier essay gave the statistician’s name for an effect of one variable that depends on the level of another: an interaction effect. The two sides of the glass interact. Weak legs cost one woman nothing and cost the other her whole street. In Chicago, the heat did its worst to people who were already ill and alone. Interactions are the part of this question I care about most, and the hardest to study. A study built to find one effect at a time can miss them. In the simplest design, pinning down an interaction as precisely as a single effect of the same size takes about four times as many people. So the two branches of the question cannot be answered one at a time either.
The surroundings’ side is easy to miss on a visit to a parent’s home, because it looks like furniture. The cue is the front door. Standing there, a visitor can count the steps between bed and bathroom and the flights between the door and the street. Then the question: which errand stopped this year, and did the body stop it or the building? A heavy door, a dark stairwell, a window painted shut: each one raises the press without touching a single organ. The decision at the end of that count is a plain one, to move the bed downstairs or to change the stairs.
Both sides of the glass can change. In 1995, Chicago met the heat with a plan on paper and five cooling centers. Few of the people who needed them came, and the warning went out late. After the dead were counted, the city rebuilt the plan around the surroundings’ side: more cooling centers, and daily contact with older residents who lived alone. City workers and volunteers called and knocked on doors. The heat came back four years later, and the third part of this series tells how the new plan did.
Ackoff drew a line between solving a problem and dissolving it. Solving finds the best answer to the problem as it was asked: a drug that pushes back a first heart attack. Dissolving changes the system around the problem until the problem has less room to happen. A knock on the door cures no one’s heart. It makes a locked window less likely to stay locked unnoticed.
“Nobody owns a problem,” Ackoff said. Closing the gap looks like a job for medicine. Half of that job belongs as much to architects, city planners, landlords, neighbors and the people who write insurance rules. Each side is still too big for one study. The next step is deciding who to compare and what to measure. The second part of this series takes it in Philadelphia in 1976, where one choice of comparison solved the case and another had hidden it. The woman of twenty-five goes with it, carrying her metformin: the same cheap pill a trial was designed to test against aging itself.
A Closing Invitation. The locked window in Chicago stood for the sick years themselves: made where a body meets its surroundings, and owned by no one. The gap closes when those years shrink, not when they move later and not one disease at a time: a healthy year is gained by raising what the body can do or lowering what the world asks, and only the living can show which.
- Before you get up, picture the windows where someone older you love lives. Does one open with one hand, or is it painted shut? Is it locked at night, and for what fear? Which answers would you have to go and look for?
- This week, write two numbers on one line, for yourself or someone you love: the years lived, and the years since the first symptom that lasted, such as a knee that never healed or blood pressure that stayed high. What share of the first is the second, and has any doctor ever written both?
- This Saturday, carry the groceries in from the car or the bus stop in one trip, the way you would want to at eighty. Which bag went down first on the stairs, which muscle gave out, and could a parent or an older friend you love make the same trip?
In July 1995, the windows stayed shut, and no one outside knew it was their job to knock. A window opens from either side: a hand on the latch, or a knuckle on the door.
Where This Came From
The piece started from a question my GapYears rerun left open: if the gap is real, who is supposed to close it? It is the gap my research statement is aimed at narrowing. Klinenberg called his book on the heat wave a “social autopsy,” an autopsy done on a city instead of a body, and the phrase is the seed of this series.
Intellectual Honesty Note. The woman of twenty-five and the two women with equally weak legs are hypotheticals; she is invented, and she carries the reader’s stakes through all four parts. “The killer was the four of them together” is this piece’s reading, not any one study’s finding. “Answerable” is the series’ own premise, not a sourced definition. The 9.3 and twelve and a half years are my GapYears rerun of WHO data for 2021.
The PCOS wait and the three professionals come from a survey of 1,385 women recruited through support-group websites, so the sample is self-selected. “Up to seven in ten” is a WHO fact-sheet figure, and the quarter more of life in poor health is a World Economic Forum and McKinsey report, not a peer-reviewed study. The podcasts are my own listening, not a study. The medical examiner’s final count was 485; the CDC’s figure shows the 465 certified by July 27. Klinenberg’s 19 and 3 are counts, not rates. The air-conditioner odds come from a model that adjusts for the other risk factors. Other accounts give the 1995 cooling centers as eleven, not five. The roof and the tree are simplifications.
References
Ackoff, R. L. (2015, November 2). Systems thinking speech by Dr. Russell Ackoff [Video]. YouTube. https://www.youtube.com/watch?v=EbLh7rZ3rhU
Attia, P., with Gifford, B. (2023). Outlive: The Science and Art of Longevity. Harmony.
Buckley, T. D. (2022). A scoping review of psychological sense of community among community-dwelling older adults. International Journal of Environmental Research and Public Health, 19(14), 8395. https://doi.org/10.3390/ijerph19148395
Centers for Disease Control and Prevention. (1995). Heat-related mortality: Chicago, July 1995. Morbidity and Mortality Weekly Report, 44(31), 577–579. https://www.cdc.gov/mmwr/preview/mmwrhtml/00038443.htm
Centers for Disease Control and Prevention. (2003). Heat-related deaths: Chicago, Illinois, 1996–2001, and United States, 1979–1999. Morbidity and Mortality Weekly Report, 52(26). https://www.cdc.gov/mmwr/preview/mmwrhtml/mm5226a2.htm
Centers for Medicare & Medicaid Services. (2012). Chronic conditions among Medicare beneficiaries, chartbook: 2012 edition.
Changnon, S. A., Kunkel, K. E., & Reinke, B. C. (1996). Impacts and responses to the 1995 heat wave: A call to action. Bulletin of the American Meteorological Society, 77(7), 1497–1506.
Chen, Z., Liu, Z., Zeng, L., Huang, L., & Zhang, L. (2023). Research on prescribing cascades: A scoping review. Frontiers in Pharmacology, 14, 1147921. https://doi.org/10.3389/fphar.2023.1147921
Crowder, M. J. (2012). Multivariate Survival Analysis and Competing Risks. Chapman & Hall/CRC.
Fries, J. F. (1980). Aging, natural death, and the compression of morbidity. New England Journal of Medicine, 303(3), 130–135.
Fries, J. F., Bruce, B., & Chakravarty, E. (2011). Compression of morbidity 1980–2011: A focused review of paradigms and progress. Journal of Aging Research, 2011, 261702. https://doi.org/10.4061/2011/261702
Gauran, I. I. (2026). GapYears (Version 1.0.0) [Computer software]. GitHub. https://github.com/gauranii/GapYears
Gelman, A., Hill, J., & Vehtari, A. (2020). Regression and Other Stories. Cambridge University Press.
Gibson-Helm, M., Teede, H., Dunaif, A., & Dokras, A. (2017). Delayed diagnosis and a lack of information associated with dissatisfaction in women with polycystic ovary syndrome. Journal of Clinical Endocrinology and Metabolism, 102(2), 604–612. https://doi.org/10.1210/jc.2016-2963
Kaeberlein, M. (2018). How healthy is the healthspan concept? GeroScience, 40(4), 361–364. https://pmc.ncbi.nlm.nih.gov/articles/PMC6136295/
Klinenberg, E. (2002). Heat Wave: A Social Autopsy of Disaster in Chicago. University of Chicago Press.
Lawton, M. P., & Nahemow, L. (1973). Ecology and the aging process. In C. Eisdorfer & M. P. Lawton (Eds.), The psychology of adult development and aging (pp. 619–674). American Psychological Association.
Lien, L. L., Steggell, C. D., & Iwarsson, S. (2015). Adaptive strategies and person-environment fit among functionally limited older adults aging in place: A mixed methods approach. International Journal of Environmental Research and Public Health, 12(9), 11954–11974. https://doi.org/10.3390/ijerph120911954
National Cancer Institute. (n.d.). Morbidity. In NCI dictionary of cancer terms. Retrieved October 6, 2026, from https://www.cancer.gov/publications/dictionaries/cancer-terms/def/morbidity
Olshansky, S. J., Carnes, B. A., & Cassel, C. (1990). In search of Methuselah: Estimating the upper limits to human longevity. Science, 250(4981), 634–640.
Semenza, J. C., Rubin, C. H., Falter, K. H., Selanikio, J. D., Flanders, W. D., Howe, H. L., & Wilhelm, J. L. (1996). Heat-related deaths during the July 1995 heat wave in Chicago. New England Journal of Medicine, 335(2), 84–90.
Senge, P. M. (1990). The Fifth Discipline: The Art and Practice of the Learning Organization. Doubleday.
Teede, H. J., Tay, C. T., Laven, J. J. E., et al. (2023). Recommendations from the 2023 International Evidence-based Guideline for the Assessment and Management of Polycystic Ovary Syndrome. Journal of Clinical Endocrinology and Metabolism, 108(10), 2447–2469. https://pmc.ncbi.nlm.nih.gov/articles/PMC10505534/
Tsiatis, A. (1975). A nonidentifiability aspect of the problem of competing risks. Proceedings of the National Academy of Sciences, 72(1), 20–22. https://doi.org/10.1073/pnas.72.1.20
Tucker, D., & McCann, R. (2025, July 14). 30 years later: What went wrong in the deadly 1995 Chicago heat wave, and what has changed since. CBS News Chicago. https://www.cbsnews.com/chicago/news/30-years-later-deadly-1995-chicago-heat-wave/
Whitman, S., Good, G., Donoghue, E. R., Benbow, N., Shou, W., & Mou, S. (1997). Mortality in Chicago attributed to the July 1995 heat wave. American Journal of Public Health, 87(9), 1515–1518.
World Economic Forum, & McKinsey Health Institute. (2024). Closing the women’s health gap: A $1 trillion opportunity to improve lives and economies. https://www.weforum.org/publications/closing-the-women-s-health-gap-a-1-trillion-opportunity-to-improve-lives-and-economies
World Health Organization. (n.d.). Global Health Observatory data repository [Data set]. Retrieved August 28, 2026, from https://www.who.int/data/gho
World Health Organization. (n.d.). Healthy life expectancy (HALE). In Global Health Observatory, Indicator Metadata Registry. Retrieved October 8, 2026, from https://www.who.int/data/gho/indicator-metadata-registry/imr-details/66
World Health Organization. (n.d.). Life expectancy. In Global Health Observatory, Indicator Metadata Registry. Retrieved October 8, 2026, from https://www.who.int/data/gho/indicator-metadata-registry/imr-details/65
World Health Organization. (2015). World report on ageing and health.
World Health Organization. (2017). Integrated care for older people: Guidelines on community-level interventions to manage declines in intrinsic capacity. https://www.who.int/publications/i/item/9789241550109
World Health Organization. (2020). Healthy ageing and functional ability [Questions and answers]. https://www.who.int/news-room/questions-and-answers/item/healthy-ageing-and-functional-ability
World Health Organization. (2026, January 22). Polycystic ovary syndrome [Fact sheet]. https://www.who.int/news-room/fact-sheets/detail/polycystic-ovary-syndrome